 Hanseul Jeong
2022.10.05
Hanseul Jeong
2022.10.05
[ICML 2022] Part 3: Neural Combinatorial Optimization studies
|
ICML 2022 (International Conference on Machine Learning 2022) is a large-scale international academic conference marking its 39th year this year. It has a citation index of 20% and an impact factor of 6.99. Participated by more than 70,000 people every year, it is deemed to be one of the most influential AI academic conferences. LG AI Research also took part in the ICML 2022 held both online and offline in Baltimore, Maryland from July 17 to 23. Three researchers from LG AI Research have selected meaningful studies that were shared at the conference. |
Introduction
Various problems that occur in everyday life correspond to Combinatorial Optimization (CO) problems. CO represents a problem in which feasible solutions are defined in discrete space or can be reduced to a discrete set. A representative example is the Traveling Salesman Problem (TSP) that determines the order of visiting locations to find which route would be the most efficient when delivering to multiple locations.
Optimization theories have been researched for a long time and many mathematical techniques for effectively finding values were suggested, but many problems of CO is NP-hard that cannot guarantee finding the solution within a polynomial time. In order to effectively solve such CO problems, Neural Combinatorial Optimization (NCO) that utilizes deep learning has recently been studied actively. We will introduce the latest NCO research trends through two studies presented in ICML 2022.
1. LeNSE: Learning To Navigate Subgraph Embeddings for Large-Scale Combinatorial Optimisation[1]
Problems can be expressed in various ways, but recent NCO studies frequently use graphs. For TSP and Capacitated Vehicle Routing Problem (CVRP) the most representative CO problems, previous studies conduct experiments with graphs having less than 100 nodes[2,3,4]. The Steiner Tree Problem (STP), which is a problem that finds the route connecting the selected points with the lowest cost, was also found to experiment by synthesizing data with a 30×30 grid graph[5].
In the real world, however, there are many situations of having to deal with larger data sizes. The figure below is a Vienna[6] dataset that collects industrial samples used in optical fiber communication network designs. It is a public dataset for STP composed of graphs with over 100,000 nodes. To cover these huge sized dataset, the research for NCO scalability is needed.
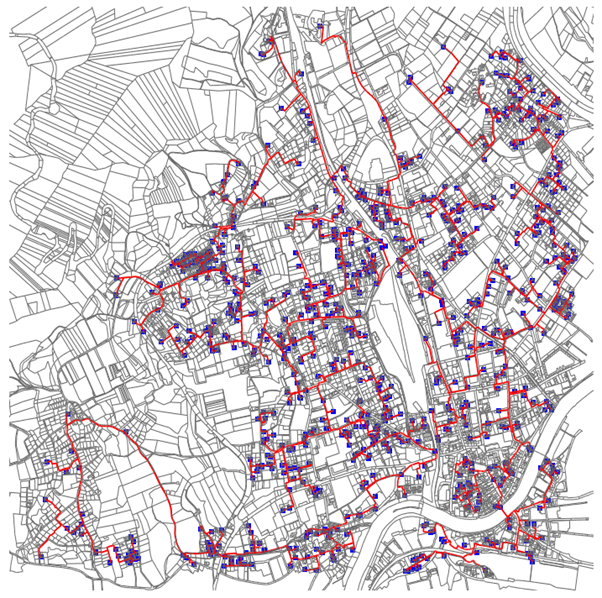
Figure 1. Vienna Dataset Sample
LeNSE is proposed to efficiently solve CO problems in a large-sized graph. The heuristic algorithm exhibits good performance, but it has limitations in that it is difficult to apply to other problems because it was designed for specific problems. The authors aim to find an efficient subgraph than to improve the algorithm, which enables to use of existing solvers and doesn’t restrict CO problems. By targeting the subgraph, which is smaller than the entire graph, it will have the effect of reducing the heuristic search space. By learning the methodology of finding the subgraph having less performance drop compared to the entire graph among such subgraphs, the authors claim that the generalized methodology can also efficiently solve scalability issues.
LeNSE can be divided into two main parts: (1) learning a discriminative subgraph representation; to show the likelihood that includes the optimal solution, and (2) subgraph navigation; to revise the subgraph to find a better subgraph based on predicted likelihood.
Learning a discriminative subgraph representation
The authors targeted budget-constrained CO problems that define the solution with a specific number of nodes. Therefore, by finding the optimal solution for a given graph, it is possible to calculate how many nodes of the optimal solution are included in the given subgraph. The paper defines a subgraph classification problem that can indirectly use likelihood that will include the optimal solution. When multiple subgraphs are given, rankings can be given based on each likelihood. K number of groups was divided according to rankings to define the class. The model composed the encoder using GraphSAGE[7] and k-pooling layer[8]. InfoNCE loss[9] was used to train the encoder, and it can be defined as follows.

and represent positive and negative samples, respectively. is a hyperparameter that adjusts how discriminative the positive and negative samples are. InfoNCE loss sets another class as an anchor with a function based on contrastive predictive coding (CPC) and makes the embedding of the sample in the same class similar. Based on , positive represents subgraph with the same class and, negative means that with a different class. Through this loss, the mutual information of and compared to the negative sample can be maximized.
Subgraph navigation
The ultimate goal of LeNSE is finding an efficient subgraph that can substitute for the entire graph. The authors used Reinforcement Learning (RL) to change the arbitrarily initialized subgraph to a better one. In order to find the subgraph that includes many nodes of optimal solutions, it was defined as a sequential decision-making problem that changes the subgraph for every step. Here, the action is modification operation of the subgraph.
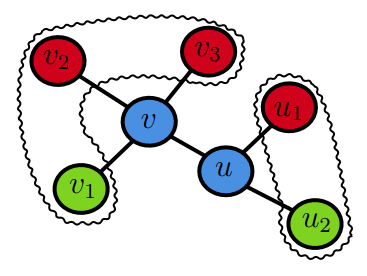
Figure 2. Modification operation
Modification operation can be designated with various methods, but the method proposed by the authors was to change the one node at a time while fixing the total number of subgraph nodes. An action is a pair of nodes which consist of one included in the subgraph and one of its neighborhood nodes. The blue nodes expressed in Figure 2 represent the nodes that compose the current subgraph. It expresses the nodes that can be paired with blue nodes with crooked lines. The green nodes represent the nodes selected to make up an action pair. In this figure, action space is defined as . If was selected, the node must be replaced from to to recompose the subgraphs of the following steps.
In order for the subgraph changed as such to include many nodes of optimal solution, the reward was designated to minimize the distance with the centroid of the subgraph embeddings that are in class 1. This represents taking action as a subgraph having embedding similar to a subgraph with high likelihood, and in conclusion, it makes it possible to learn the policy that changes it to a subgraph that includes a lot of optimal nodes.

Where is centroid, is subgraph embedding of the step, and is the hyperparameter that adjusts the reward size. Q-learning was used basically for learning, but the given optimal solution information was utilized as prior during learning to use guided q-learning that changed the epsilon greedy.
Experiments
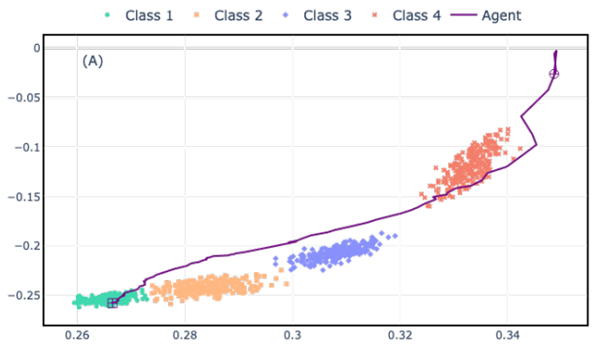
Figure 3. Subgraph Trajectory according to Time Step
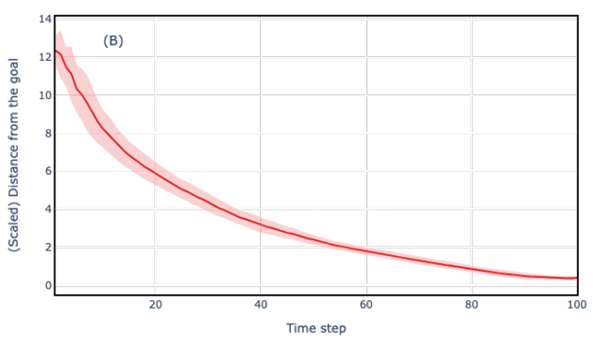
Figure 4. Change of Distance with Centroid according to Time Step
Figure 3 is a figure that visualizes the trajectory to check how the location of the subgraph changes on the embedding space according to the time step to quantitatively check whether the model is learned well. The start point is marked with circles and the solid purple line shows the changing process, and the last point is expressed with rectangles. The starting value is a randomly initialized subgraph, thus showing that it is far away from the class, but it is evident that it gradually comes closer to the subgraph embedding cluster that is part of class 1. Figure 4 shows that both average and deviation gradually reduces as time step continues that shows the distance with the centroid, thus demonstrating that the LeNSE is being learned well according to the objective.
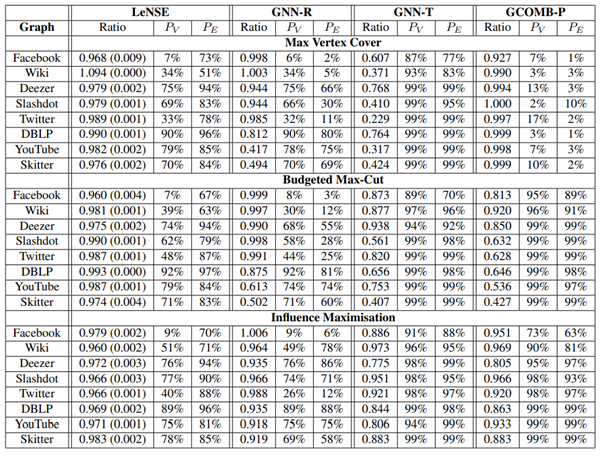
Table 1. Experiment Performance Comparison Table
Table 1 shows quantitative comparison performance with other methodologies. GCOMB-P[10] is a SOTA model and GNN-R and GNN-T are GNN classifiers that select top-k nodes according to each ranking and all nodes having la ikelihood of being higher than the threshold. Ratio represents the ratio found by dividing the results of the heuristic solver in the entire graph wbythe result in value of the subgraph found by the model; the higher the value, the closer it is to optimal.
LeNSE doesn’t outperform and is not dominating in multiple settings, but when compared to other methodologies, it is evident that it has good performance without much deviation. This result is further maximized when compared to the size of the subgraph. When seeing and that represent the ratio of the selected subgraph’s node and edge ratio, the remaining baselines excluding GNN-R that fixed the number of selected nodes have very big values in BMC and IM. This means that because the size is similar to the entire graph, when the size of the problem increases, efficiency decreases. Compared to this, it is possible to see that LeNSE continuously finds out smaller subgraphs than the original size in various settings, and it can also be seen that it has a strong performance as well. GNN-R also has overall good performance, and you can see that ratio performance drops in YouTube and Skitter datasets that have large graph sizes. In comparison, it is evident that LeNSE is effective for efficiently composing the subgraph without a drop in performance resulting from size issues.
An interesting aspect is that for the MVC problem, the ratio value of the Wiki dataset is larger than 1, which indicates that when looking the subgraph, the results of the heuristic solver is better than when looking the entire problem. This is because the solution may not be optimal (since a heuristic algorithm was used), but it is interesting that looking only at the subgraph showed improvements in the quality aspect of the result rather than the entire graph.
2. Augment with Care: Contrastive Learning for Combinatorial Problems[11]
The second paper to be introduced proposed a methodology for the boolean satisfiability problem (SAT). SAT corresponds to CO and it judges whether it is possible to input true or false values for each variable of a logical expression to turn the results of the logical expression as true (=sat). Figure 5 expresses the logical expression as a bipartite graph. The two clauses connected with ∧ are expressed as , respectively, and they can show the relationship with each variable.
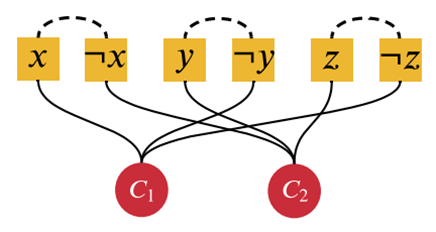
Figure 5. SAT Expressed with a Bipartite Graph
In order to effectively predict SAT results, the authors focused on data augmentation techniques. There was a problem that when applying augmentation techniques used in other domains, SAT problem did not preserve the label. For example, Figure 6 shows a photo of a cat that applied augmentation techniques commonly used in vision domain. The presented techniques can transform the original image to make the distribution of the limited learning data more abundant, but it generally did not show changes of the label such as turning images of cats to dogs.
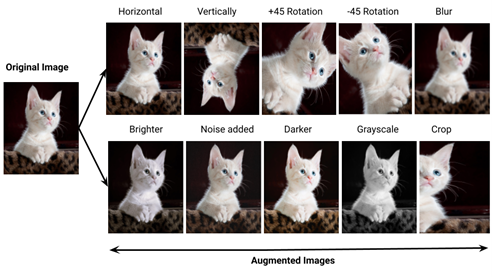
Figure 6. Representative Augmentation Technique used in the Image
Label-preserving augmentation (LPA)
But techniques such as node dropping used for graph data have the problem that they can change the SAT label. In order to address this issue, the authors proposed six augmentation techniques that do not change the label of the problem using SAT domain knowledge. To explain using Unit Propagation (UP), which is one of the six, if there is a clause composed only of the variable , even if all clauses with that variable are removed and the variable’s negative is deleted, it will have the same label. (The sample of applying UP is in Figure 7.) Each augmentation is explained in further detail in the original text. As shown in Figure 7, the input composed of a single logical expression applies augmentation to create different sample ,. For the N samples in the mini-batch, a total of 2N samples can be created through each augmentation, and each of them are converted to bipartite graph to go through the encoder to find the embedding. The encoder is composed of NeuroSAT[12], which is the SOTA of SAT.
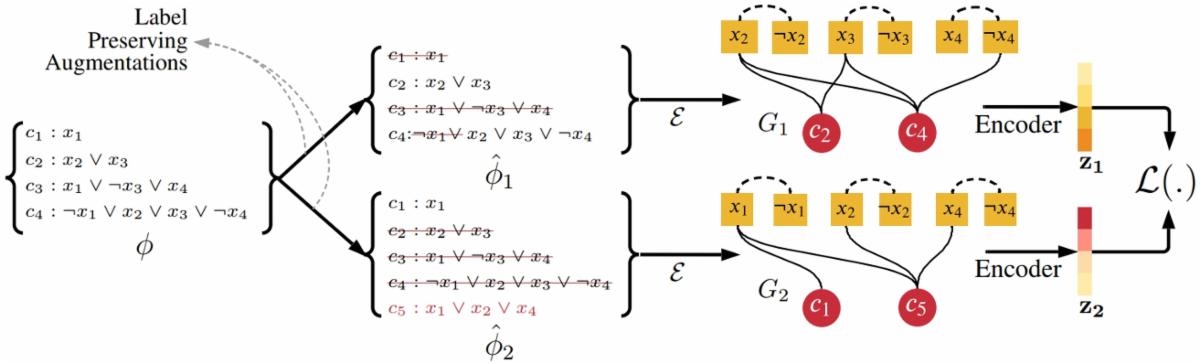
Figure 7. 전체 모델의 구조
In order to effectively learn the representation of the generated data without a label, simCLR[13] contrastive loss was used, and the equation is as follows.

Where measures the similarity of two embeddings, , represents the embedding of two samples created with the same sample, and τ is the temperature parameter. The samples augmented from the same sample are positive and the other samples are categorized as negative, thus having an effect of learning the encoder by raising the similarity of the embedding.
Experiments
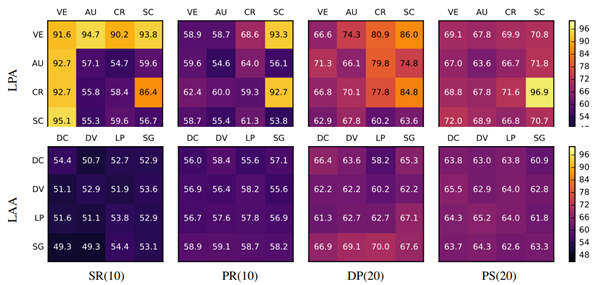
Figure 8. Performance Comparison Heat Map
Figure 8 applied two techniques corresponding to each axis to compare the LPA method proposed by the authors and the general graph augmentation technique, or in other words, label agnostic augmentation (LAA), and then visualized its accuracy with a heat map. The diagonal entries in each matrix represent one type and if not a diagonal, it represents accuracy when using two types of augmentation techniques. The technique shown in the row is the technique that is applied first. SR and PR data are made up of 10 variables, and DP and PS are composed of 20 variables, thus making it a longer logical expression.
Overall, it is evident that the performance of LPA is a bit higher than LAA in various data and combinations. When checking the maximum performance, in the order of SR, PR, DP, and PS data, LPA is 95.1, 93.3, 86.0, and 96.9, while LAA is 54.4, 59.1, 70.0, and 65.5. It thus shows that a better representation can be learned when using LPA. In addition, when comparing with cases that are not diagonal entries, it is evident that using two types of augmentation had more improved performance than when applying one augmentation. But it also had the limitation that there was high-performance difference according to the dataset similar to normal augmentation, and that performance fluctuated significantly depending on the type or even the order of the augmentation combination.
Conclusion
We introduced two papers on NCO that was presented at the ICML 2022. The two papers used contrasting strategies as the former shifted the perspective to a subgraph navigation problem to exclude the features of CO while the latter proposed an augmentation technique reflecting the features of SAT to utilize domain knowledge. But the fact that both papers improved performance by utilizing contrastive loss to obtain good representation while focusing on completely different CO problems show that representation learning is also effective in NCO. If the focus was on applying ML for CO in the past, recent studies attempted to improve performance with good representation considering the features of CO, thereby showing that the NCO sector has made progress. We hope that in the future, there will be active research and interest in combinatorial optimization problems that have not been dealt with, and that such results will be applied in various industries.
- 참고
- [1] Ireland, D., et al. (2022). “LeNSE: Learning To Navigate Subgraph Embeddings for Large-Scale Combinatorial Optimisation.” arXiv preprint arXiv:2205.10106. [2] Kim, M., et al. (2021). “Learning collaborative policies to solve NP-hard routing problems.” Advances in Neural Information Processing Systems, 34, 10418-10430. [3] Kool, W., et al. (2018). “Attention, learn to solve routing problems!.” arXiv preprint arXiv:1803.08475. [4] Kwon, Y., et al. (2020). “Pomo: Policy optimization with multiple optima for reinforcement learning.” Advances in Neural Information Processing Systems, 33, 21188-21198. [5] He, Y., et al. (2020). “Circuit routing using monte carlo tree search and deep neural networks.” arXiv preprint arXiv:2006.13607. [6] Leitner, M. et al. (2014). “New real-world instances for the Steiner tree problem in graphs.” ISOR, Uni Wien, Tech. Rep. [7] Hamilton, W., et al. (2017). “Inductive representation learning on large graphs.” Advances in neural information [8] Cangea, C., et al. (2018). “Towards sparse hierarchical graph classifiers.” arXiv preprint arXiv:1811.01287. [9] Oord, A. V. D., et al. (2018). “Representation learning with contrastive predictive coding.” arXiv preprint arXiv:1807.03748. [10] Manchanda, S., et al. (2020). “Gcomb: Learning budget-constrained combinatorial algorithms over billion-sized graphs.” Advances in Neural Information Processing Systems, 33, 20000-20011. [11] Duan, H., et al. (2022). “Augment with Care: Contrastive Learning for Combinatorial Problems.” In International Conference on Machine Learning (pp. 5627-5642). PMLR. [12] Selsam, D., et al. (2018). “Learning a SAT solver from single-bit supervision.” arXiv preprint arXiv:1802.03685. [13] Chen, T., et al. (2020). “A simple framework for contrastive learning of visual representations.” In International conference on machine learning (pp. 1597-1607). PMLR.