 Juhyun Lyu
2021.10.05
Juhyun Lyu
2021.10.05
[ICML 2021] Part 3: Spatio-temporal Time-series Forecasting in 2021 ICML
|
The International Conference on Machine Learning 2021 (ICML 2021) is a large-scale international conference that attracts around 70,000 participants each year. This year marks the 38th iteration. It is also one of the most influential conferences in the field of artificial intelligence with thesis acceptance rate of 20% and impact factor of 6.99. Here is a summary of the meaningful research papers shared at the conference, picked by three researchers from LG AI Research who participated in the ICML 2021 held online from July 18 to 24. |
This year’s ICML was held online due to the current COVID-19 situation like the previous year. It was interesting that even social meetings as well as keynote speeches, workshops, and poster sessions in each field were held online, but it was a shame that there were very limited opportunities to attend presentations in person and communicate with other participants through questions. However, great presentations in a wide range of fields are provided in the form of records and can be revisited. If you are interested, I recommend visiting the ICML 2021 website.
Time series forecasting
At ICML 2021, I mainly attended research projects that use time-series data, which is what I am currently working on. Time series is a field that is experiencing very rapid growth. As a lot of data in the world are recorded in the form of time series, it is widely used in various areas. For example, it is being widely used in climate science, which predicts weather or climate change, economy such as predicting stocks, and healthcare.
Among the research fields, the time-series forecasting field that is currently conducting research is described as follows: It is a task of predicting data or data distribution in the future based on the time-series data of a given past. For example, this includes demand forecasting—which is to predict future demands—and price prediction, which is to predict product prices. 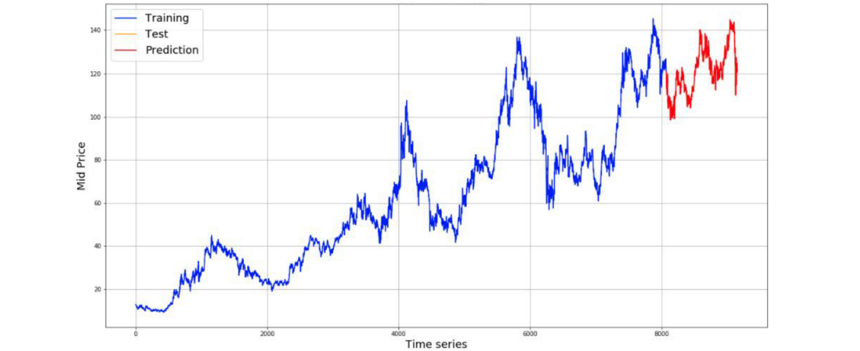
Stock price prediction, image source: Deep stock predictions(‘20. arxiv)[1]
Predicting time-series data for some time in the future requires identifying characteristics of the past data that is given. Based on this, it is possible to predict the future data. In this process, the most common properties that we need to identify are trend and seasonality. Trend is a property that indicates the increasing or decreasing trend of the time-series data during a unit period. Seasonality is a property that indicates periodicity, or repeating itself every certain period.
Spatio-temporal time-series forecasting
Although it is a practical area, it is possible to divide cases into different categories based on the data given to perform a time-series forecasting task. In other words, it is possible to divide the cases into those wherein additional information that helps identify the data’s characteristics is given, and those cases wherein such information is not given.
First of all, if information such as “promotion information” or “production plan” is given as additional data, it would be very helpful in predicting whether the demand would increase or decrease. When this kind of additional information was not given, however, it is necessary to identify the characteristic through an internal analysis of the given time-series data, and then make a prediction for the future time.
Among the fields that involve analyzing the characteristics of the given data, spatio-temporal time-series forecasting is a research field that predicts future data by identifying the characteristics that can be gained from correlations between time-series data and temporal correlation from sequence of time.
If only univariate time-series data is given, it will be possible to make future predictions only by identifying temporal correlations within the time series. If multi-variate time-series data is given, however, identifying spatial correlations within the time-series will be essential in making future predictions successfully. In this process, identifying and modeling spatial correlations are a very complex process. Various studies based on deep learning are being conducted to identify this.
Nowadays, graph-network is being used widely in order to identify the relationship between complex time series. In the case of graph network, it is a concept that is used in various fields in addition to time-series prediction. It is a way of expressing data, using each node to indicate the given data and the edge to represent the relationship between various data. This concept can be applied to the social network, and then expressed in the form of a graph as seen below. 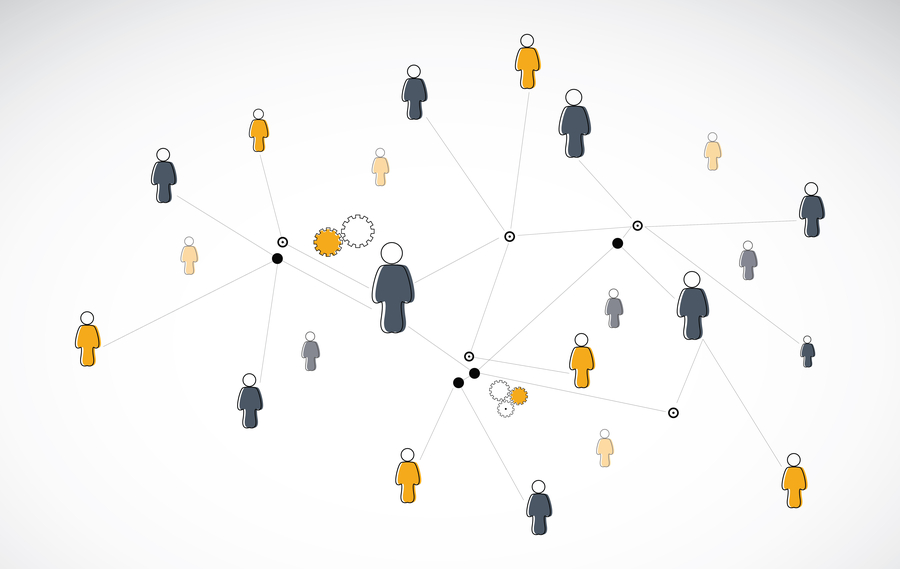
Graph of Social Network
Among the time-series papers introduced at ICML this year, I would like to introduce two research papers on graph-based spatio-temporal time-series forecasting, which predict the future by identifying the characteristics of given time-series data.
|
1. RNN with Particle Flow for Probabilistic Spatio-temporal Forecasting (PAL, Soumyasundar, et al., 2021)[2] |
RNN with Particle Flow for Probabilistic Spatio-temporal Forecasting(PAL, Soumyasundar, et al., 2021)[2]
The purpose of this paper is to conduct both point forecasting and distribution for predicting future data by suggesting a structure wherein RNN and Graph Convolutional Network (GCN) are combined in order to conduct spatio-temporal forecasting, followed by a particle flow modeled on the existing particle filter.
Motivation
The following are suggested as the limitations that should be overcome by existing SOTA algorithms: Point forecast models do not identify uncertainty. Although it was possible to identify uncertainty from the numerous probabilistic models that have been studied, no study has been done using graph.
As the first step of a novel contribution to overcome the limitations mentioned above, this paper suggests a framework combining RNN and GCN, which can be used for both univariate and multi-variate. Secondly, the paper suggests an inference process that has the form of combining graph convolutional learning, probabilistic state-space model, and particle flow.
Main Idea & Contributions 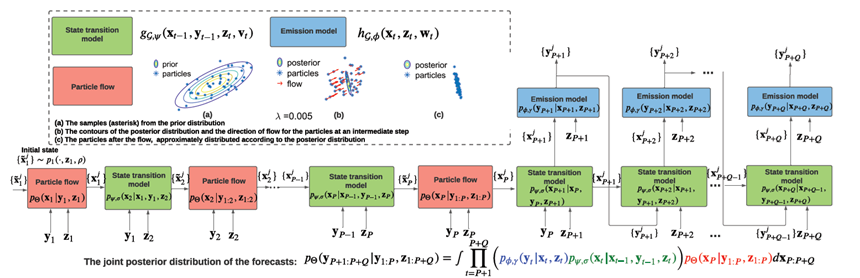
The followings are summary of the major ideas presented in the paper:
① State transition model : The green part in the picture above.
RNN and GCN were combined (Reference: AGCGRN (’20. NIPS)[4]) to create a probabilistic state transition model. The role of the state transition is to predict posterior distribution (: predictive distribution). It receives inputs for time state(xt-1), observation(yt-1), and covariance(zt-1) in the previous step, and then outputs the predictive distribution.
② Particle flow : The red part in the picture above.
The particle flow models the particle filter, which approximate the posterior distribution of the state trajectory pθ(xt|y1:t) recursively. (xt : state at time t, y1:t : abservation from time 1 to t) (Reference: The paper’s Supplementary Material, Particle Flow Bayes’ Rule (’19. ICML)[5])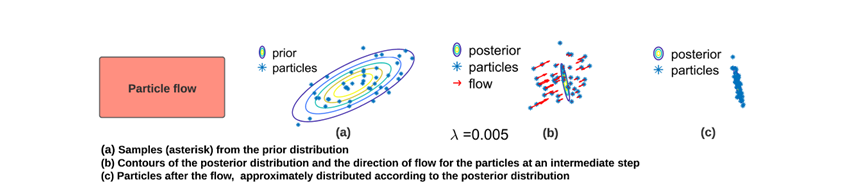
If you look at the picture above, you can see that the particles distributed in the prior distribution migrate to the posterior distribution through the particle flow. (λ : time interval) In this paper, the role of particle flow is to migrate the predictive distribution predicted in the state transition model to the predictive distribution.)
③ Emission : The blue part in the picture above.
The role is to predict the future data () (or distribution) recursively through the approximated posterior distribution (
).
The structure above can be expressed in an equation below. According to the paper, the equation below is intractable. But now it is possible to solve intractable joint posterior problems through the methods suggested above.
Additionally, the paper stated that this model can be used for both point forecasting and probabilistic forecasting. Such result could be achieved by varying the loss function in each task.
- For point forecasting: MAE, MSE 
- For probabilistic forecasting: negative log posterior probability 
Experimental Results and Analysis
① Baselines: In this paper, as an SOTA algorithm for performance comparison, it performed comparisons not only with graph-based spatio-temporal point forecast models, but also with graph agnostic point forecast models and probabilistic forecast models. I think the authors tried to compare the performance of various baselines, because it was revealed in the paper that graph-based models show better performances than non-graph models at the recent spatio-temporal model, and they wanted to prove it.
② Dataset: For the comparison with graph-based models, they used Road traffic dataset (PeMSD3, 4, 7). (PeMSD: (When expressing the installed sensors on a map using the traffic speed data collected from sensors installed on the roads in a particular area, it can be regarded as a fixed graph.) Since it is not appropriate to use the data above for non-graph-based models, electricity (electricity consumption), traffic (traffic occupancy rate), and Wikipedia (number of clicks that web links get) dataset was used for performance comparison.
③ Metrics: For point forecasting performance evaluation, MAE, RMSE, and MAPE were used. For probabilistic forecasting performance evaluation, CRPS and Quantile Loss were used. 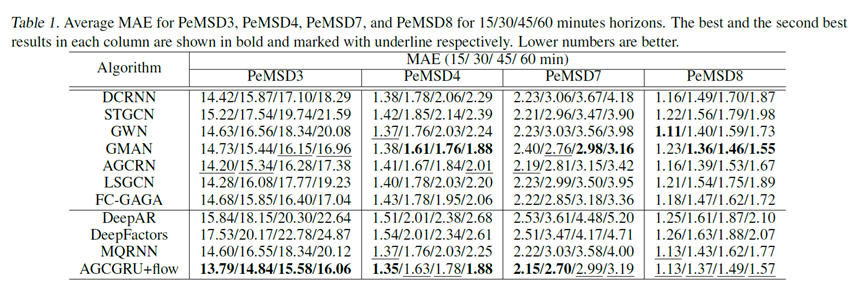
First, through the point forecasting test using preMSD data, it was confirmed that graph-based models generally make better predictions, and proposed AGCGRU + flow (the RNN of the conventional AGCRN was used as GRU) shows good performances in general.
For the probabilistic forecasting models, the models that proposed flow was applied shows better performances than graph-agnostic models. 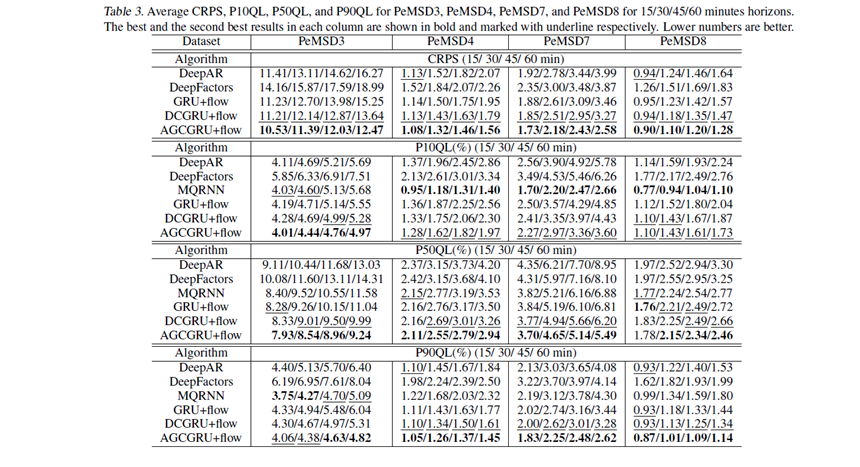
Conclusion & Discussion
This paper suggested a general Bayesian framework that can express a certain forecast uncertainty by proposing new methods: a graph-based state space model and particle flow.
In fact, when I first started to study time-series forecasting, I got the intuition that predicting point-wise future data based on probabilistic information would be useful for my research. With the structure that this paper provided, I think it could give me the insight that I could refer to. In this paper, it didn’t deal with how to form a graph, so it would be my future assignment for my research
Z-GCNETs: Time Zigzags at Graph Convolutional Networks for Time Series Forecasting(Chen, Yuzhou, et al., 2021)[3]
This paper suggests a model for performing time-series forecasting, which applies a mathematical concept utilizing topological information called zigzag persistence.
Motivation
Conventional deep learning models have intrinsically static characteristics, meaning they cannot reflect information of time-dimension during learning process systematically. Because of this, conventional approaches require frequent model updates, and it is difficult to adopt to the changing environment over time.
As a way of overcoming such limitations, the paper suggests applying the mathematical concept called zigzag persistence to deep learning models in order to “use the most salient time-conditioned topological information for improving model performance.”
Main Idea & Contributions
The followings are a summary of the major ideas presented in the paper:
① Time-aware zigzag persistence into time-conditioned graph structure
First, they applied a mathematical tool called zigzag persistence homology[6] so that the topological feature can be used in a time-conditioned model. Simply put, persistence homology is a tool that is used to extract the topological feature in the transformation process (filtration process) of the graph. 
Graph filtration
To explain briefly, filtration can be simply understood as a growth sequence of the graph. The creation and destruction of components (node, edge) occurring in this process can be recorded through the persistence diagram[7], and then this information can finally be used as a topological feature. 
Persistence diagram
In other words, when referring to the persistence diagram above, the components that remain for a long time despite the creation and destruction of node and edge can be considered to imply more critical topological information in the graph.
Zigzag persistence homology is a generalized form of persistence homology. While the conventional persistence homology has one direction, filtration is possible in both directions (zigzag filtration) in zigzag persistence homology. Accordingly, it helps analyze a pairwise structure within the graph. 
② Zigzag persistence image (ZPI)
In the paper, the authors suggested a method called zigzag persistence image so that topological features can be used to learning. ZPI compresses topological information in the form of image so that it can be analyzed in deep learning models. To achieve this, it converts information in persistence diagram into an image form through processes such as mapping, discretization, and integration. 
Persistence image
③ Z-GCNETs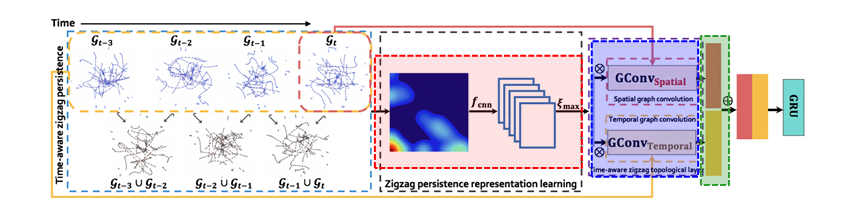
Lastly, it suggests Z-GCNETs, a network structure wherein topological features can be used together with spatial-temporal features. Z-GCNETs consist of processes such as Extraction + Aggregation + Combination.
Among these, in Extraction (the red box in the picture above) process, it extracts and learns the spatial-temporal topological features included in ZPI, which inputs into CNN. In Aggregation (the blue box in the picture above) process, it collects spatial-temporal topological information and the information converted by graph convolution. In Combination (the green box in the picture above) process, it combines the spatial-temporal information and spatial-temporal topological information extracted and collected previously, and then passes them to the GRU step.
Experimental Results and Analysis
① Baselines: In this paper, not only existing spatio-temporal graph models, but also RNN-based models, self-attention models, and statistical time-series models were used for performance comparison.
② Dataset: The dataset used for the performance comparison was Road traffic dataset (PeMSD4, 8) which was used in the previous paper. The authors also conducted a price prediction test using Ethereum (a cryptocurrency) token network dataset (Bytom and Decentraland). In the Ethereum token network, each node indicates the user address, and the edge indicates transaction. It is a graph network formed according to the daily transaction based on a certain time during the day. Given the high complexity of the applied Ethereum network, however, the authors extracted a sub-graph that has 100 nodes for the purpose of this paper.
③ Metrics: MAE, RMSE, MAPE, etc. were used as metrics for the performance evaluation.
According to the test result, Z-GCNETs showed better performances than other conventional baselines in the test using PeMSD data. 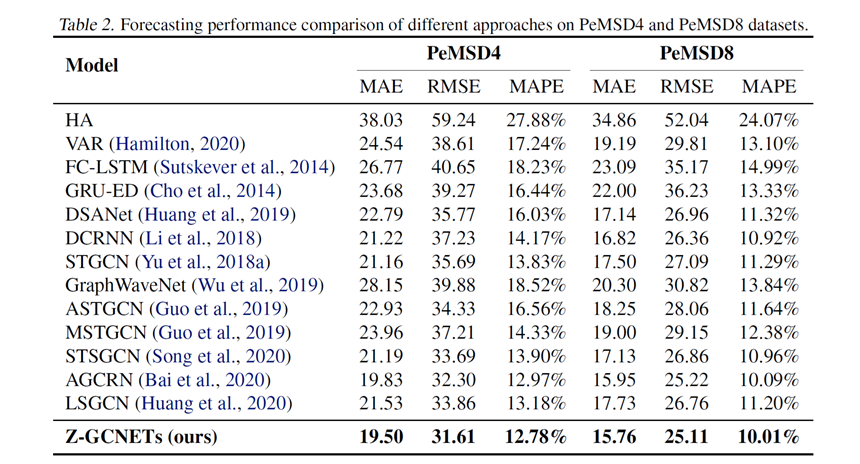
They also showed the best performance in the test using the Ethereum token network. 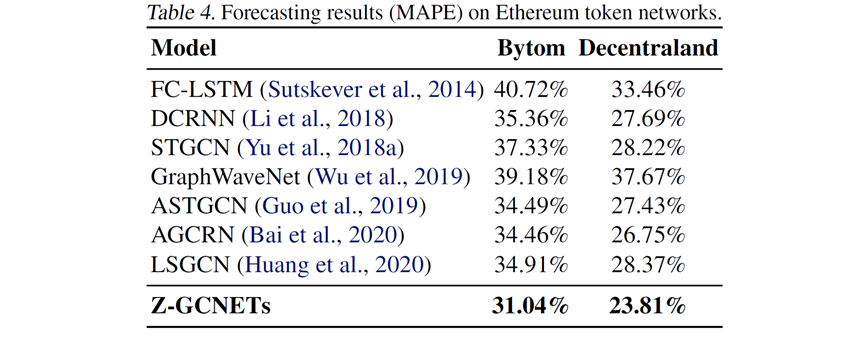
The results above show even better performances than AGCRN, which recently showed the best performance among models with a spatio-temporal graph structure. In the paper, the authors tell that such good performance indicates that Z-GCNETs are utilizing topological information very well.
Conclusion & Discussion
The paper suggests that the proposed zigzag persistence can be used to trace topological features very well over time, and that it is possible to learn time-aware topological characteristics of the data very well through the time-aware zigzag topological layer, which was proposed additionally in the paper.
Personally, I thought using topological information in time-series forecasting was a good idea. However, I thought the main contribution of this research paper was the application of the zigzag persistence concept since there were previous studies that already tried to use topological information.
Conclusion
Attending ICML 2021 this year, I focused on the research works that touch my current area of interest—that is, how to use most information within the time-series data to build a forecasting model that has good performance. It was for my personal journey of making a general model that always maintains good forecasting performances for any kind of time-series data. In order to achieve this, I could utilize the idea of using distribution information in point-wise prediction—which was introduced in the first paper—and apply the idea of maximizing the use of time-series data through topological information as suggested in the second paper.
Participating in the conference this year, I not only got to gain such insights but also realized that there are many areas that I need to study. I felt like I came home with a lot of assignment. For example, I thought research on graph generation according to the changing input needs to be pursued for the utilization of graph-based models.
LG AI Research is currently conducting various time-series forecasting projects requested by various subsidiary companies. If you look at the given data, they show characteristics wherein node and edge constantly change according to new product launch and discontinuation of existing products. In this regard, I thought studies on how to generate graphs should also be conducted at the same time. I think I need to communicate more actively with my fellow researchers at LG AI Research, with whom I can discuss future research topics during my study.
ICML 2021 Review ③ DiLab Juhyun Lyu (Link)
- 참고
- [1] DOSHI, Akash, et al. Deep stock predictions. arXiv preprint arXiv:2006.04992, 2020.
[2] PAL, Soumyasundar, et al. RNN with Particle Flow for Probabilistic Spatio-temporal Forecasting. arXiv preprint arXiv:2106.06064, 2021.
[3] CHEN, Yuzhou; SEGOVIA-DOMINGUEZ, Ignacio; GEL, Yulia R. Z-GCNETs: Time Zigzags at Graph Convolutional Networks for Time Series Forecasting. arXiv preprint arXiv:2105.04100, 2021.
[4] Bai, L., Yao, L., Li, C., Wang, X., and Wang, C. Adaptive graph convolutional recurrent network for traf?c forecasting. In Proc. Adv. Neural Info. Process. Systems, 2020.
[5] CHEN, Xinshi; DAI, Hanjun; SONG, Le. Particle flow Bayes’ rule. In: International Conference on Machine Learning. PMLR, 2019. p. 1022-1031.
[6] CARLSSON, Gunnar; DE SILVA, Vin. Zigzag persistence. Foundations of computational mathematics, 2010, 10.4: 367-405.
[7] A gentle introduction to persistent homology. https://christian.bock.ml/posts/persistent_homology/