 Kyungeun Lee
2024.01.24
Kyungeun Lee
2024.01.24
[NeurIPS 2023] Tabular Learning Research Trends Observed at NeurIPS 2023
During NeurIPS 2023, LG AI Research’s Data Intelligence (DI) Lab presented its report “Binning as a Pretext Task: Improving Self-Supervised Learning in Tabular Domains” at the Table Representation Learning Workshop.
Tabular data, which is a type of structured data, is data that is arranged in rows and columns in a table format that is easily readable in a database. Unlike unstructured data such as data consisting of images, text, and audio, deep learning has yet to show good performance when using tabular data in this format. To address this, various technologies, distinct from those that are currently in place, have been proposed that are specialized for the tabular domain. It has become commonly known that, in order to tackle problems relating to tabular data, understanding irregular functions such as discrete functions is key. On the other hand, deep networks are known to converge easily to very complex and smooth functions, which is why they do not perform as well in the tabular domain.
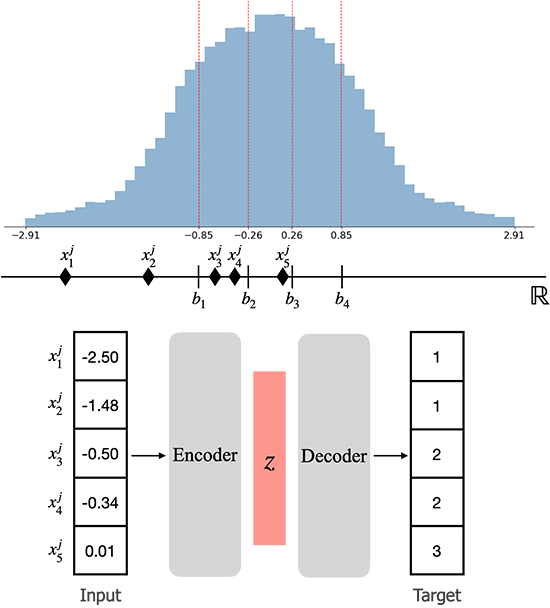
Figure 1. Schematic diagram of binning as a pretext task for self-supervised learning[7]
To efficiently overcome these limitations that deep networks have, this study utilizes a binning algorithm that can convert continuous variables into discrete variables. In particular, this study considers an unsupervised setting where no label information is provided. As illustrated in Figure 1, this method uses an autoencoder architecture. However, this approach predicts the binning class values of the input values, rather than the input values themselves. At this point, binning is performed on the training data, with the number of bins being set by the user as the hyperparameter. The advantages of this method are as follows. (1) First, as the target is changed from a continuous variable to a discrete variable, inductive bias is imparted to enable the learning of irregular functions. (2) Due to the nature of tabular data, numerical values and categorical variables may be mixed. This issue can be effectively solved by setting the target to a bin, a discrete variable, for all variables. (3) If values within the training data distribution are similar, they can be treated as the same bin. This allows for the grouping of similar values. (4) Minor errors that include unnecessary patterns can be ignored. (5) Creating equal sets for all variables (or features) containing the same elements prevents unnecessary variables from hindering learning. (6) By changing only the target information and loss function, any additional variations are possible. For example, a sophisticated network of arbitrary encoders can be used, additional augmentations can be applied, and the result can even be combined with other loss functions as a weighted sum.
As a result, it was shown to perform well on a total of 25 datasets for various downstream tasks, including binary classification, multiclass classification, and regression. In particular, it was confirmed that even when compared to Tree-based algorithms trained in a supervised setup and the latest and greatest deep network-based algorithms, similar or better performance could be observed.
During NeurIPS 2023, a number of research results specialized in the tabular domain that were similar to those of this study were presented. A total of 10 studies were presented at the main conference, with 4 studies that summarize benchmark datasets and algorithms in specific problem settings such as distribution shifts or synthetic data. Also presented were 3 studies applying ideas from graph representation learning to tabular representation learning.
In addition, 2 studies analyzed the performance of deep learning compared to gradient boosted decision trees (e.g. XGBoost, CatBoost) and 1 study focused on improving the performance of tabular learning using transformer models. In this piece, we will focus on 3 research papers among the various studies on tabular domains that propose different methodologies.
1. When Do Neural Nets Outperform Boosted Trees on Tabular Data?
To experimentally analyze the differences in performance between neural networks (NNs) and gradient-boosted decision trees (GBDTs) in the tabular domain, this study conducted a large-scale experiment and summarized the results. We analyzed 10-fold cross-validation results for 176 datasets, 19 algorithms, and 30 hyperparameter settings. Additionally, TabZilla benchmarks were published for the 36 most challenging datasets.
The main research questions of this study can be summarized as follows.
(1) Is there a single algorithm that performs well for all the different datasets?
(2) Can the performance of a particular algorithm be explained in relation to some characteristic of the dataset?
To answer both of these questions, a large-scale experiment was conducted as part of this study. First, 3 GBDTs (CatBoost, LightGBM, XGBoost) were used as algorithms. Additionally, 11 NNs (DANet, FT-Transformer, MLPs, NODE, ResNet, SAINT, STG, TabNet, TabPFN, and VIME) and 5 simple baselines (Decision Tree, KNN, Logistic Regression, Random Forest, and SVM) were used as models. For the dataset, we used a total of 176 classification datasets accessible in the Python OpenML[4] Library. To analyze the statistical properties of the data related to downstream task performance, we utilized a total of 965 meta-features available in the Python PyMFE[5] Library. These included general attributes such as the number of samples, classes, and feature composition but also statistical attributes like minimum and maximum values.
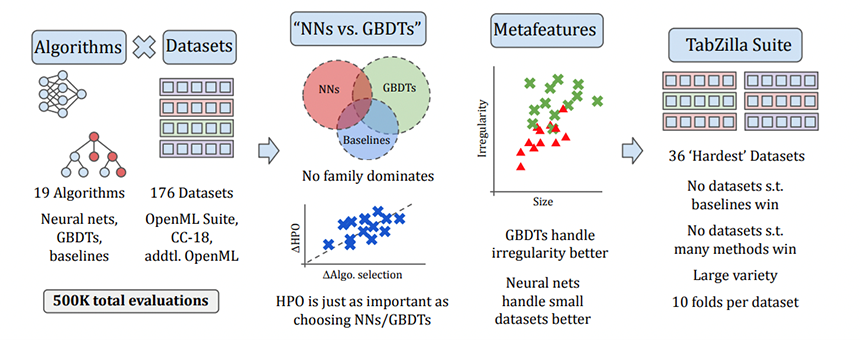
Figure 2. Overview of the paper’s analysis method[1]
The results of the experiment are summarized as follows. First, there was no single algorithm that was found to do everything well. All algorithms were found to rank first or last in at least 1 dataset. Among them, CatBoost was found to perform best, with an average rank of 6.12 out of 21 algorithms.
Among the NNs, TabPFN[6]performed the best. In particular, it exhibited fast learning speed. As for large data, it is shown to exhibit similar performance to CatBoost despite only using 3,000 images for learning due to memory issues. However, when comparing GBDTs to NNs, GBDTs performed better in more cases.
Therefore, finding good hyperparameters among the GBDTs is expected to be very helpful in getting the best performance out of the current algorithms. In particular, the analysis results of meta-features showed that GBDTs perform better than NNs on more irregular data, large datasets, or when the ratio of the data size to the number of features is high. Finally, based on the results of the large-scale experiments described above, 36 analyzed datasets that were identified as the most difficult for NNs were released as TabZilla benchmarks.
This study has conducted the largest experiment in the tabular domain to date and has summarized research results for a variety of meta-features. As a result, it has been confirmed that GBDTs perform better than the currently proposed NNs. This indicates the need for research on effective deep learning architectures and learning methods that can cope with the irregularities of tabular datasets and situations when large-scale data is used.
2. A Performance-Driven Benchmark for Feature Selection in Tabular Deep Learning
Unlike other data, tabular datasets contain numerous features. Even new features are created through feature engineering. At this point, neural networks are known to easily overfit noisy features. In order to analyze and solve this problem, this study provides a feature selection benchmark and proposes a methodology called Deep Lasso.
The benchmark includes 12 datasets (8 classification, 4 regression), 3 additional features, and 9 feature selection methods. The additional features include random features which correspond to Gaussian noise and corrupted features where a few features are selected and corrupted with Gaussian noise. In addition, there are second-order features, which are defined as the product of the values of a few features that are selected.
Feature selection methods include the Univariate Statistical Test, Lasso, First-layer Lasso, Adaptive Group Lasso, LassoNet, Random Forest, XGBoost, Attention Map Importance, and Deep Lasso. Among these, Deep Lasso is the first method proposed in this study and corresponds to the Group Lasso Penalty for gradients for each sample during learning.
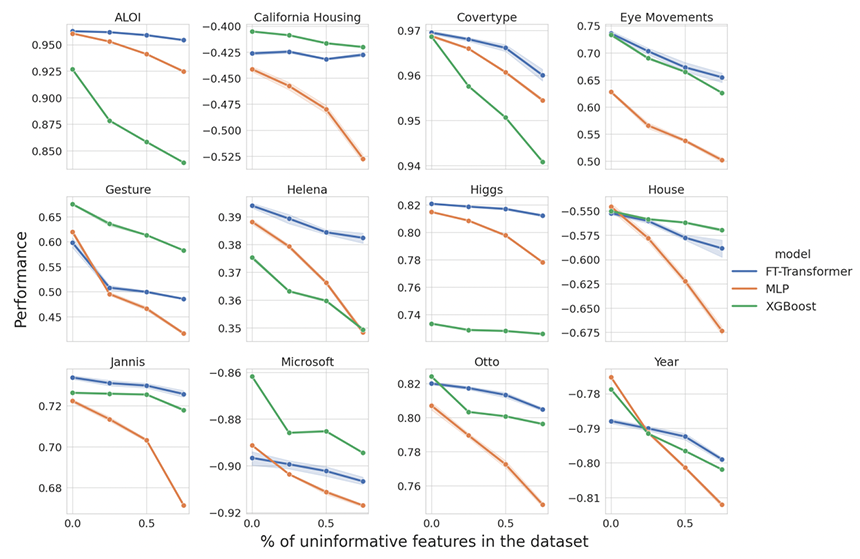
Figure 3. Performance degradation due to the addition of uninformative features[2].
Each plot corresponds to the results of individual data, where the X-axis represents the ratio of uninformative features, the Y-axis represents performance, and the colors indicate their respective prediction models[2].
Experimental results show that Deep Lasso exhibited good performance, especially for second-order features. When feature selection methods are used together in cases where there are many unnecessary features, a significant performance improvement can be observed compared to learning from raw data.
This study is significant in that it highlights a feature selection problem that has never before been addressed, while proposing both a benchmark and a novel solution to the problem. By providing experimental evidence for the problem of neural networks easily overfitting unnecessary features and proposing a possible solution, this study is expected to provide good guidelines for further research.
3. HyTrel: Hypergraph-enhanced Tabular Data Representation Learning
When a language model learns by converting a tabular dataset to a sequence of tokens, it is unable to reflect the structural characteristics of the table. For example, even if the tables’ rows and columns are rearranged arbitrarily, the meaning remains the same. This study proposes HyTrel (hypergraph-enhanced tabular data representation learning) as a tabular language model that can learn representations that take table structure into account. HyTrel considers permutation invariance and three structural properties through hypergraphs. The three structural characteristics are as follows.
(1) Values of the same column are semantically similar.
(2) It can have complex relationships of higher than pairwise dimensions.
(3) Information is organized in a hierarchical manner.
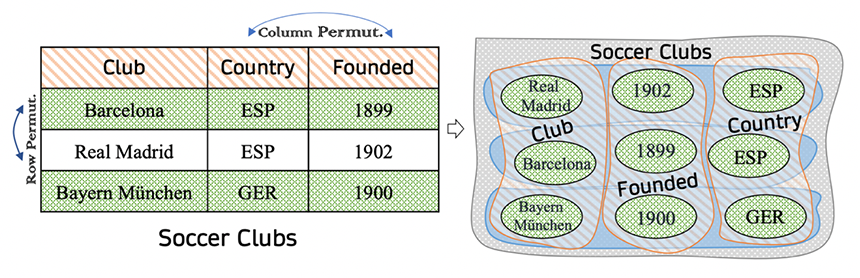
Figure 4. Hypergraph definition example[3]
The table is transformed into a hypergraph as shown in Figure 3 above. In this case, each node in the hypergraph corresponds to a cell value, with the hyperedge having three values: column, row, and table. In this study, a hypergraph is determined based on whether a node and a hyperedge are linked.
For example, in the figure above, Barcelona has (Barcelona, Club)=1, (Barcelona, Country)=0, and (Barcelona, Founded)=0 as columns. For rows, it has (Barcelona, 1)=1, (Barcelona, 2)=0, and (Barcelona, 3)=0. And for the table, it has (Barcelona, Soccer Clubs)=1.
After being converted to a hypergraph, the embedding layer calculates the embedding of each node and the hyperedge. The learned representation is then processed through a hypergraph encoder consisting of a structure-aware transformer module. Two types of pre-training heads were utilized: an ELETRA head and a contrastive head.
To confirm the experimental performance of this methodology, an experiment was conducted on a total of four tasks. First, column type annotation (CTA) is the problem of matching the semantic type of a column, which is very important in fields such as entity recognition and entity linking. Column property annotation (CPA) is the problem of finding relationships in the knowledge graph from a table. Table type detection (TTD) is the problem of matching the semantic type of a table, and table similarity prediction (TSP) is the problem of predicting the similarity between tables to determine whether two tables are related.
As a result, HyTrel performed well on all four tasks. Specifically, the ELECTRA head performed better on the CTA and CPA questions and the contrastive head achieved high performance on the TTD and TSP questions. It was found that a hypergraph was useful in improving performance since it performed well even when trained without pre-training.
Every year, the number of published research papers on tabular learning is increasing. LG AI Research also presented a workshop on tabular learning at NeurIPS 2023. During the TechTalk session, various individuals within the industry enthusiastically discussed how the binning method can be applied in supervised or semi-supervised settings, in addition to unsupervised settings. They also discussed how to practically utilize these models in the industry and explored potential applications. This helped with the realization of the necessity and importance of tabular learning.

Figure 5. NeurIPS 2023 TechTalk session presentation
LG AI Research DI Lab plans to conduct more advanced tabular learning research based on the various research methodologies and results discussed at NeurIPS 2023, as well as through our own various experiences and gained insights. We also plan to continue to research new models, considering various benchmarks and data and thinking about how to utilize them in business. In particular, LG AI Research DI Lab is currently conducting research focusing on problems that arose due to the characteristics of tabular data. These issues include: (1) the difficulty defining samples with similar definitions, (2) the significant variations in data structure and dimensions, and (3) the need for developing a deep network using the advantages of tree-based machine learning algorithms, etc. At the same time, research is also underway to create a foundation model that performs well in various tasks such as TabPFN. We are also trying to create a model that can consider not only classification problems but also regression problems. If we can develop a model that performs well with tabular data, which is often used not only in research but also in various industries, we anticipate that we will be able to create significant value industrially.
▶ Want to learn more about the NeurIPS 2023 Research Blog series? (Link)