 Youngsan Koh
2024.02.15
Youngsan Koh
2024.02.15
 Cui Run
2024.02.15
Cui Run
2024.02.15
 Sangyun Kim
2024.02.15
Sangyun Kim
2024.02.15
 Byungjun Kang
2024.02.15
Byungjun Kang
2024.02.15
 Jeeho Hyun
2024.02.15
Jeeho Hyun
2024.02.15
 Giyoung Jeon
2024.02.15
Giyoung Jeon
2024.02.15
 Donghun Lee
2024.02.15
Donghun Lee
2024.02.15
[WACV 2024] Industrial Anomaly Detection and Utilization in the Vision Inspection
1. Introduction
Anomaly detection refers to the field that seeks to identify patterns in a dataset that deviate from the expected observed values, rather than the anticipated patterns. When a change occurs, humans have the ability to distinguish whether it is a normal data pattern that occurs normally or an anomaly pattern. This is because we have learned and memorized aspects of normal data patterns. Anomaly detection technologies that use deep learning similarly detect anomalies by learning and memorizing the normal pattern distribution of data and then detecting patterns that deviate from it.
These anomaly detection technologies are also widely used in the security and financial sectors to detect anomalies occurring on a network or to predict cloned or stolen credit cards by looking for signs that a customer's spending patterns are abnormal.
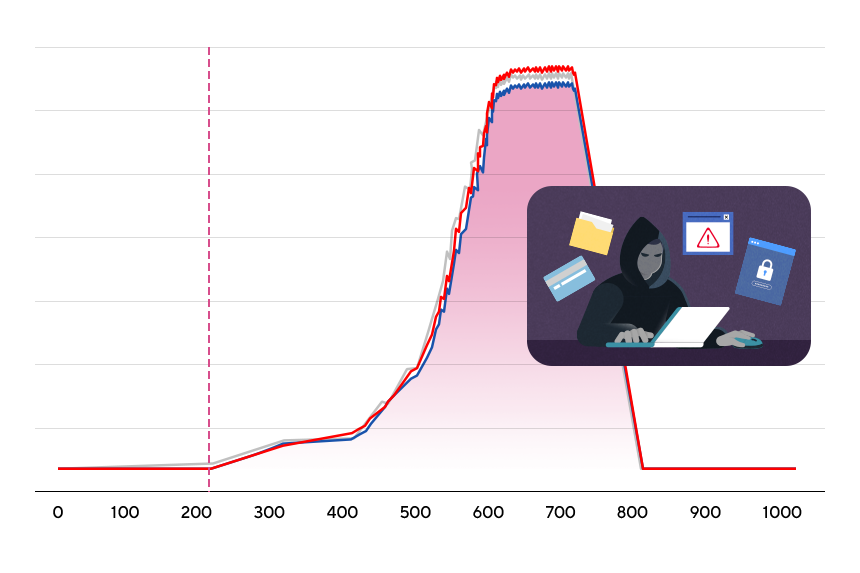
Image 1. Image illustrating an example of an anomaly deviating from a recurring normal pattern
2. Industrial anomaly detection technology in the vision inspection field
In the manufacturing industry, finding defective products is a critical component of quality control. Vision inspection aims to detect detects on the product surface, and deep learning based algorithms are increasingly being used to overcome the limitations of rule-based algorithms.
Companies are working to maximize productivity and put a lot of effort into their production process lines to produce large-scale products without defects. As a result, defects occur only in a very small number of products, causing class imbalance problems. These problems lead to biased results from deep learning models that classify products as good or defect. Additionally, classification models are more likely to make incorrect predictions when faced with new types of defects different from the types at the time of learning.
These problems can be solved with anomaly detection models, which learn and memorize the typical feature distribution of normal products and then detect features that deviate from it. Detecting anomalies in product images can be categorized into three forms, as shown in Figure 2 below. While there is a view that density- and distance-based methods can be grouped together as embedding-based methods and categorized into two forms, we will look at them as three forms.
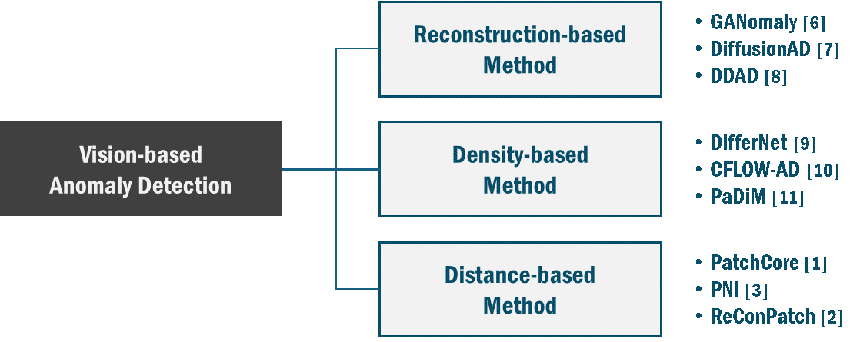
Figure 2. Three ways to detect anomalies in product images
Reconstruction-based methods first train a model that represents the feature structure of a normal product image as a reduced dimensional embedding vector, and detect anomalies by using the deviation of the reconstruction error during the process of reconstructing the image from the reduced dimension. Compared to normal products, anomalous product images have higher reconstruction errors. Methods using autoencoders or generative adversarial networks have been proposed, but recently, methods using diffusion models have been published and are gaining popularity as generative models.
The second, density-based method utilizes the property that anomalous data in a product is likely to be located at a low density. This method detects anomalies by modeling a probability density function from normal product images and measures the probability density of the given input data. Anomaly detection algorithms based on Gaussian mixture models, normalizing flows, etc. fall into this category.
Finally, distance-based methods refer to detecting anomalies by numerically measuring how far they are from representative features of a given normal product image. PatchCore, announced at CVPR 2022, is the leading distance-based method and was achieving SOTA performance on the MVTecAD dataset leaderboard from May 2021 to early 2023.
Various AI technologies are being researched and utilized to increase productivity and efficiency in industrial settings. LG AI Research’s Vision Lab is also conducting research on vision inspection AI for quality control in product production. This post will introduce PatchCore, one of the leading algorithms for industrial anomaly detection, and ReConPatch, which LG AI Research presented at WACV 2024, the leading conference on computer vision.
3. PatchCore
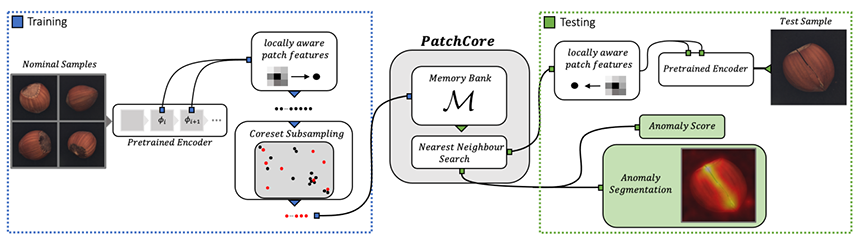
Figure 3. PatchCore Schematic Diagram[1]
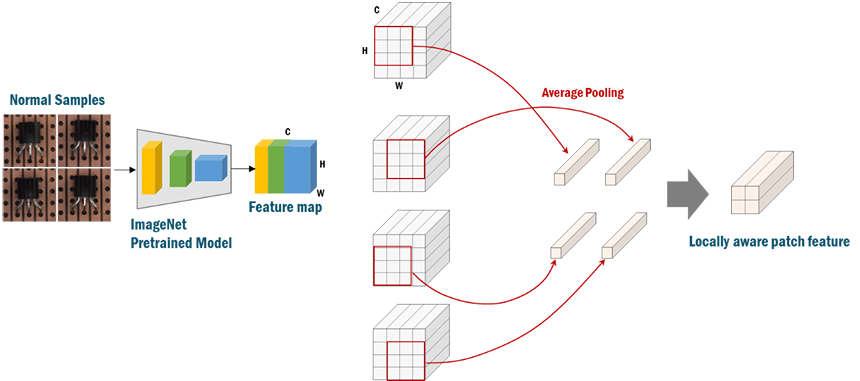
Figure 4. Patch Feature Extraction Process
In the patch feature extraction process, the results of each convolutional neural network are combined in the ImageNet pre-trained model to create a feature map. The parts of each convolutional neural network with different resolutions are scaled by interpolation to have the same resolution. A patch feature is an aggregate of an area of size p in the feature map, extracted through average pooling. Here, Figure 4 shows an example when p is 3.
Since many patch features are extracted from even one normal product image, a huge amount of patch features is generated from numerous normal product image during training. Therefore, storing all patch features in a memory bank requires a huge increase in the size of physical memory, and the larger number of feature comparisons increases the inference time. To solve this issue, patch features must be selected and stored, and as random sampling is likely to select duplicate patch features and fail to preserve the feature distribution, coreset sampling is used to select patch features.
The process of sampling a coreset is shown in Figure 5 below. After randomly selecting the initial coresets, the process is repeated from (c) to (d) until n coresets are finally obtained. Representative features that preserve the diversity of the overall feature distribution are selected through coreset sampling, and when learning is complete, n representative patch features of the normal product are stored in the memory bank.
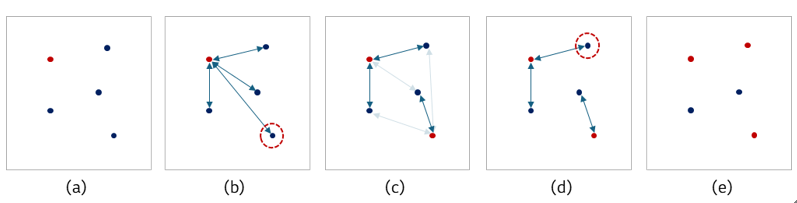
Figure 5. Example of the coreset sampling process: (a) randomly selects one feature as the initial coreset,
(b) measures the distance from each feature to the coreset and selects the farthest feature as the coreset,
(c) measures the distance from each feature to the coreset and selects the nearest coreset for each feature,
(d) selects the feature with the longest distance among the selected distances as the coreset, and (e) selects three coresets.
Given an input image, it infers whether the input image is a normal product through comparison with representative features of normal products stored in the memory bank. The nearest neighbor search finds the coresets of the memory bank that are closest to the features extracted from input image in the same manner as mentioned above and calculates the distance between them. It finds the maximum value of the calculated distance and uses it as the anomaly score. If the anomaly score is higher than a predefined threshold, it determines the product as an anomaly.
4. ReConPatch
Because PatchCore uses a model trained on the ImageNet dataset consisting of natural data rather than data from an industrial site, we can see scattered distributions of features even though they are extracted from the same location, as shown in Figure 6. As a wide feature distribution means that there is a lot of variation between normal product images, so there is a possibility that a given input image will be measured as a high anomaly score despite being a normal product image. To address these issues, ReConPatch[2]learns to reduce the variance of similar patch features while increasing the deviation between dissimilar features. This allows us to extract features that are more suitable for detecting anomalous products, as shown in the figure 6.
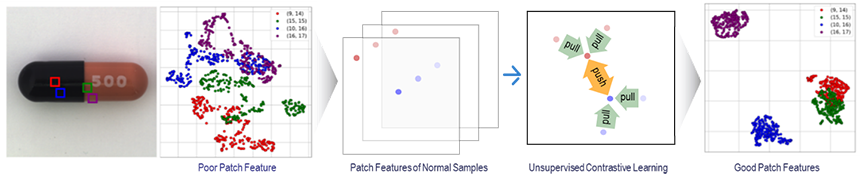
Figure 6. Transforming feature distributions in an embedding space with patch feature learning[2]
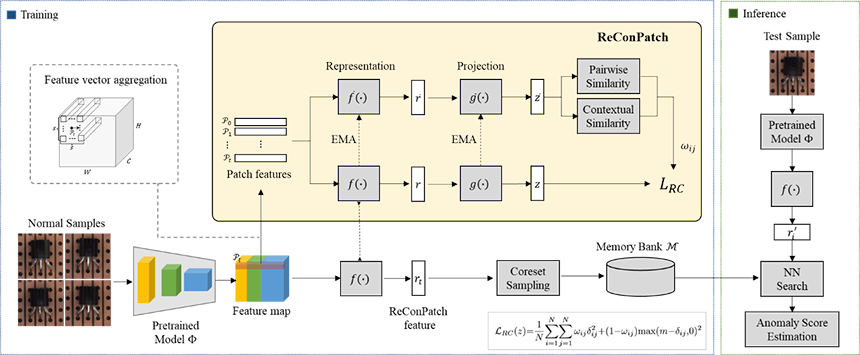
Figure 7. ReConPatch schematic diagram[2]
As shown in Figure 7, ReConPatch measures the pairwise similarity and contextual similarity between patch features and learns to attract patch features closer if the similarity is high and repel further apart by a predefined distance () if the similarity is low. Even if they have the same pairwise similarity, they may need to repel each other, as in case (a) of Figure 8, or they may need to move closer because they are part of the same cluster, as in case (b). Contextual similarity refers to measuring how many k-nearest samples are intersecting between two target ones, and is used in conjunction with pairwise similarity to learn better representations.
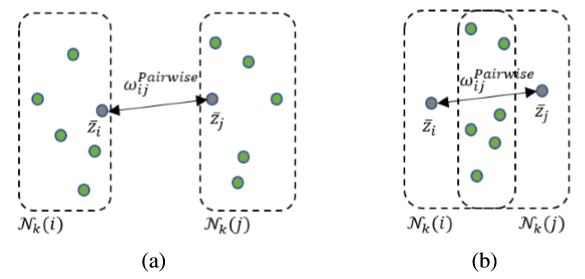
Figure 8. Example of similarity measurement of patch features[2]
It was found that the prediction area of ReConPatch was wider than the actual anomaly. Post-processing to calibrate the anomaly score map can help achieve more precise results. Similar to the approach proposed by ‘Pni: industrial anomaly detection using position and neighborhood information’[3], we first merge the manually generated abnormal regions into the normal image, and use the synthesized image as input to the ReConPatch. RefinementNet is trained with a loss function that minimizes the difference between the predicted anomaly score map from the ReConPatch and the actual ground-truth image with manually generated abnormal regions. It calibrates the anomaly score map of the ReConPatch, resulting in the improved results as shown in Figure 9.

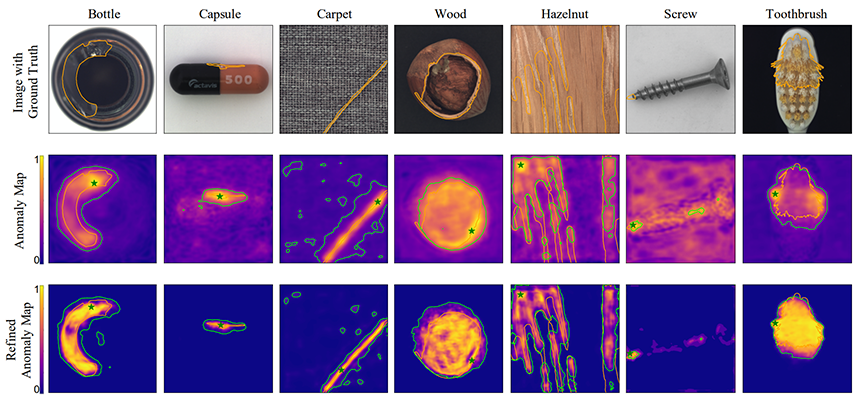
Figure 9. Post-processing of the anomaly score map and its results[2]
ReConPatch, presented by LG AI Research at WACV 2024, shows SOTA performance in the MVTecAD dataset leaderboard[4, 5] as shown in Table 1. In particular, it shows excellent accuracy in the AUROC image, which is an evaluation index for the task of distinguishing between normal and abnormal product images.
| Method |
Image AUROC (Classification) |
Pixel AUROC (Segmentation) |
| ReConPatch Ensemble (w/ refinement) | 99.86 (1st) | 99.20 (2nd) |
| ReConPatch Ensemble | 99.72 (4th) | 98.67 (15th) |
Table 1. ReConPatch performance on MVTecAD dataset[2]
5. Conclusion
So far, we covered industrial anomaly detection technology in the field of vision inspection and a paper on the achievements of LG AI Research’s anomaly detection technology presented at WACV 2024. Despite many advances in anomaly detection technology through deep learning, there still remains the problem of poor performance due to the widespread feature distribution in normal products when there are large environmental changes during the production process. However, because it is very difficult to collect data on defective products due to the nature of manufacturing environments, anomaly detection technology is very useful and is likely to be improved with the advancement of deep learning. LG AI Research’s Vision Lab is also looking forward to expanding the use of AI in industrial environments by further developing vision inspection AI technologies that can overcome limitations in manufacturing environments and efficiently inspect external defects in appearance.
▶ReConPatch : Contrastive Patch Representation Learning for Industrial Anomaly Detection (Link)
- 참고
[1] K.Roth et al, “Towards Total Recall in Industrial Anomaly Detection,” CVPR 2022
[2] Jeeho Hyun et al, “ReConPatch : Contrastive Patch Representation Learning for Industrial Anomaly Detection,” WACV 2024
[3] Jaehyeok Bae et al, “Pni: industrial anomaly detection using position and neighborhood information.” pages 6373?6383, 2023.
[4] https://www.mvtec.com/company/research/datasets/mvtec-ad
[5] https://paperswithcode.com/sota/anomaly-detection-on-mvtec-ad
[6] Samet Akcay et al, “GANomaly: Semi-Supervised Anomaly Detection via Adversarial Training,” ACCV 2018
[7] Hui Zhang et al, “DiffusionAD: Norm-guided One-step Denoising Diffusion for Anomaly Detection,” arxiv 2023.
[8] Arian Mousakhan et al, “Anomaly Detection with Conditioned Denoising Diffusion Models,” arxiv 2023.
[9] Marco Rudolph et al, “Same Same But DifferNet: Semi-Supervised Defect Detection with Normalizing Flows,” WACV 2021
[10] Denis Gudovskiy et al, “CFLOW-AD: Real-Time Unsupervised Anomaly Detection with Localization via Conditional Normalizing Flows,” WACV 2022
[11] Thomas Defard et al, “PaDiM: a Patch Distribution Modeling Framework for Anomaly Detection and Localization,” ICLR 2020