 Hyeokjun Choe
2026.05.14
Hyeokjun Choe
2026.05.14
Toward a reliable AI forecasting system: Long-term lithium price forecasting
When evaluating AI forecasting models, the first metric people typically look at is accuracy. If someone says, “This model achieves 90% accuracy,” many people assume the model performs well enough. However, in real-world decision-making, the question goes beyond simply whether the model is accurate enough.
“Can I trust this forecast enough to make a decision?”
In particular, in situations involving significant capital investment, such as mining investments or long-term supply contracts, where the impact of decisions extend over several years, accuracy alone is not sufficient. It is essential to explain why the forecast was derived in that way, what market structures and assumptions were incorporated, and whether industry experts find the results convincing.
This was precisely the fundamental question we faced in the long-term lithium price forecasting project conducted jointly by LG AI Research and LG Energy Solution. “What constitutes a reliable forecast?”
The Data Intelligence Lab at LG AI Research addresses forecasting, anomaly detection, and decision-making optimization problems based on industrial data such as manufacturing data and supply chain data. Among these, the long-term lithium price forecasting project was directly linked to core decision-making in LG’s strategically pursued Clean Tech initiatives, particularly the battery business.
1-1. Why it's difficult to forecast lithium prices
Lithium is a key raw material for rechargeable batteries. While the use of nickel or cobalt may vary depending on the battery type, lithium is universally used in lithium-ion batteries. As the electric vehicle market expands, lithium is becoming increasingly important as a strategic raw material that determines the cost competitiveness and supply stability of the battery industry.
The issue is price volatility. Over the past five years, lithium prices have fluctuated by more than tenfold from their lowest point. The price of lithium carbonate, which had been around $7,000 per ton, surged to approximately $80,000 following the COVID-19 pandemic before plummeting again. Since then, volatility has persisted. Prices, which stood at around $10,000 per ton in the fourth quarter of 2025, recently rose to approximately $20,000 per ton in the first quarter of 2026.
There are structural reasons behind these sharp fluctuations. In the early stages of the COVID-19 pandemic, some mining operations and project developments were scaled back or delayed due to shrinking demand; however, as demand for electric vehicles and batteries recovered rapidly following the transition to an endemic phase, supply was unable to keep pace. Furthermore, as the lithium market is relatively small compared to major raw materials such as iron ore or copper, imbalances in supply and demand can lead to more pronounced price volatility.
As a result, the long-term forecasts issued by traditional IBs (investment banks) and market research firms often failed to adequately reflect the sharp fluctuations in actual prices. While the forecasts indicated a relatively moderate trend, actual prices fluctuated dramatically in the short term due to supply-and-demand shocks and market sentiment.
_aa8fbeb51.png)
Image 1. Comparison of actual lithium prices vs. institutional forecasts, 2015-2025[1]
Image 1 is a graph comparing actual lithium prices with historical forecasts from major institutions. The blue line represents actual lithium prices, while the orange and green lines represent the long-term forecasts released by institutions in the fourth quarter of 2018 and the first quarter of 2023, respectively. While institutional forecasts showed a relatively gradual trend, actual prices surged sharply in a short period before plummeting again.
1-2. Long-term forecast for upstream investment
The objective of this project was to forecast lithium prices over the next five years. The reason for taking such a long-term view of lithium prices is related to upstream investment. While short-term price fluctuations can be partially mitigated by adjusting purchase timing or modifying contract terms, securing structural cost competitiveness in a highly volatile market requires evaluating upstream assets, such as lithium mines and salt lakes, that can ensure a stable supply of raw materials.
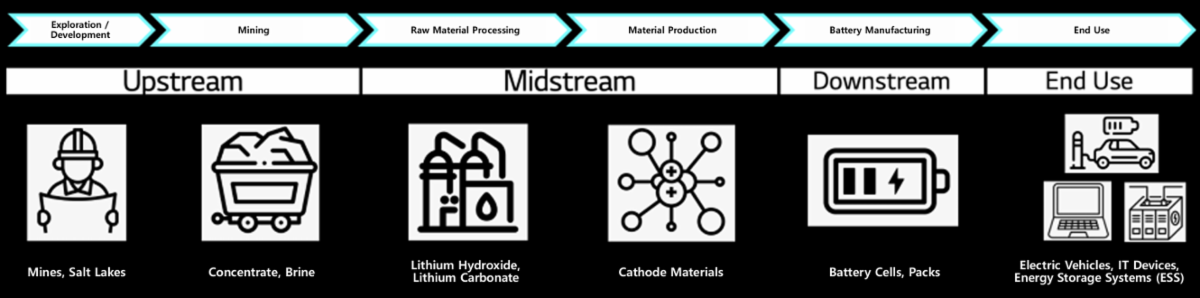
Image 2. Lithium-ion battery value chain[1]
Lithium occurs naturally primarily in the form of ore or brine. Mines and salt lakes where lithium ore or brine can be extracted are collectively referred to as lithium projects. The challenge is that it generally takes several years from the start of development to initial production. In this project, it was necessary to view prices from a long-term perspective of approximately five years, taking this investment and development lead time into account.
In other words, even if demand for lithium surges, it is difficult to increase supply in the short term. Because supply is inelastic, in situations where demand is growing rapidly, such as in the electric vehicle and battery markets, supply-demand imbalances can lead to significant price fluctuations.
Therefore, when forecasting lithium prices, it is not sufficient to look only at price trends for the coming month or quarter. As factors such as rising demand, supply expansion, project delays, and increased production capacity take several years to be reflected in prices, a forecasting system must take into account both the long-term supply-demand structure and investment lags.
2-1. The price formation mechanism matters more than the forecast result
“Lithium prices will reach $○○ per ton next year.”
While such a definitive forecast may seem intuitive, it may not be sufficient for decisions where the cost of a forecasting error is high, like large-scale investments or long-term supply contracts. Decision-makers need more than just a price figure; they require an explanation of the market structure and assumptions upon which the forecast is based.
Existing deep learning-based time series forecasting excels at predicting future values by learning patterns from historical data. However, in markets like the lithium market, where demand, supply, inventory, production capacity, investment delays, and policy changes interact in complex ways, there may be limitations in explaining exactly which factors and pathways led to those forecast values.
Market forecast reports and news articles can also serve as important reference materials. However, since they often focus on individual factors such as rising demand, supply delays, and declining inventories, they have limitations in illustrating how these factors are interconnected within the overall system and how they ultimately influence prices.
Therefore, in this project, we did not view lithium prices as a single, isolated time series. Instead, we sought to consider key factors driving prices such as demand, supply, inventory, production capacity, investment delays, and policy changes in tandem, and to structure how these factors interact with one another to influence price formation.
The key here was not to include as many variables as possible in the model, but rather to identify the factors and relationships that are actually meaningful to lithium price formation and organize them into a structure that the forecasting model could utilize. The next section will examine the process of extracting price-influencing factors from experts’ explanations in market reports and news, and refining them into a causal map through quantitative data analysis and review by domain experts.
2-2. Structuring factors affecting lithium prices using a causal map
Based on the issues outlined above, this project began by identifying the factors that drive lithium prices and mapping out the relationships between them. Our analysis did not rely solely on quantitative data. We also drew on market forecast reports and expert commentary from lithium-related news articles.
To do this, we used unstructured text data such as market forecast reports and lithium-related news as input to broadly extract the various cause-and-effect relationships described within the text. In this process, we utilized LLM-based causality extraction techniques[2,3] to structure the causal relationships among various factors like demand, supply, investment, policy, and price changes as explained by market experts. In other words, rather than selecting only factors that directly influence lithium prices from the outset, we collected relationships regarding “which factors lead to which outcomes” as broadly as possible and used them to construct a Raw Causal Map.
_19eb3f6d1.png)
Image 3. Raw Causal Map
The Raw Causal Map included the following factors.
-
Demand-side factors: EV sales, EV subsidies, tax credits for new energy vehicles, etc.
-
Supply-side factors: Investment in lithium projects, lithium hydroxide production volume, production capacity for lithium compounds, etc.
However, we could not directly incorporate all factors extracted from unstructured text into the model. Factors that could be verified using quantitative data like price, sales volume, and production volume were linked to actual data to examine their relationships. On the other hand, factors that were difficult to quantify or for which data was limited, such as policy changes or market sentiment, were categorized separately.
In this process, we utilized a Causal AI-based review methodology[4,5] in conjunction with quantitative data analysis. This allowed us to verify whether the causal relationships extracted from the text were confirmed as meaningful relationships in the actual data, and whether they possessed explanatory power and practical applicability when incorporated into forecasting models. In doing so, we incorporated not only quantitative metrics but also qualitative reviews based on domain knowledge. As a result, we selected factors and relationships from the Raw Causal Map that could be utilized in actual modeling to construct a Refined Causal Map.
As an example of this refinement process, some market reports explain that rising oil prices can affect lithium prices through their impact on electric vehicle demand and logistics costs. The reasoning is that when oil prices rise, electric vehicles become relatively more attractive to buyers compared to internal combustion engine vehicles, while at the same time, logistics costs like ocean freight rates increase, which can also affect lithium prices.
However, an analysis based on actual data revealed that the impact of oil prices on lithium prices was more limited than expected. This demonstrates that even factors that appear plausible in theory may not provide sufficient explanatory power when examined with actual data. Therefore, rather than simply accepting the causal relationships extracted from the text, this project selected only those relationships that could be effectively utilized in actual modeling after conducting a thorough review of the data and the domain expert review.
Finally, the Refined Causal Map was cross-validated with domain experts from LG Energy Solution. Through this process, we distinguished between factors that have a substantial impact on lithium prices and those that do not, as well as between predictable and unpredictable factors. In other words, rather than simply feeding a large number of variables into the model, we refined the structure so that it could be effectively utilized in actual decision-making.
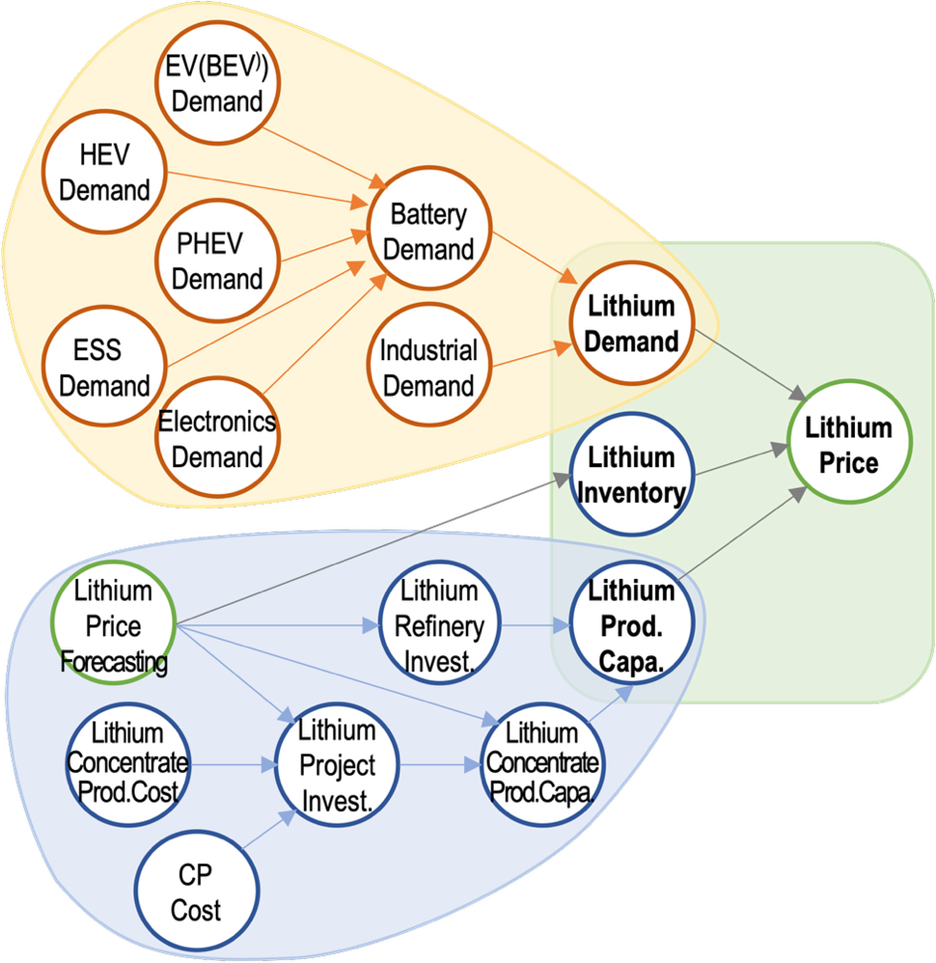
Image 4. Refined Causal Map
2-3. Building a hybrid forecasting system: Mechanism model, deep learning, and simulator
While traditional time-series forecasting methods focus on estimating future prices based on past trends in lithium prices, this project aimed to incorporate the causal factors driving price movements and their relationships into the model architecture.
To achieve this, this project developed a causality-based hybrid forecasting system that combines mechanism modeling, deep learning, and domain simulation based on the Refined Causal Map. In this system, the Mechanism Model represents the fundamental structure of lithium price formation, the Deep Learning Model learns the complex nonlinear relationships hidden within the data, and the Domain Simulator supplements supply-side decision-making which is difficult to explain using historical data alone.
However, considering business sensitivity and operational know-how, this post describes the detailed model architecture, training methods, and simulation rules used in the actual operational environment only at a high level. Instead, this section will focus not on specific model names or implementation details, but on why this hybrid structure was necessary and what role each component played within the forecasting system.
The hybrid forecasting system consists of a mechanism model that describes market structure, a deep learning model that learns data-driven patterns, and a domain simulator that models supply-side decision-making. The roles of each component are outlined in [Table 1].
| Component | Role | Necessity |
| Mechanism Model | Reflecting price formation structures such as supply, demand, inventory, and production capacity |
To treat price as a result of market structure rather than a simple pattern |
| Deep Learning Model | Learning non-linear relationships and complex interactions between variables |
To capture non-linearities that are difficult to explain using only rules or linear equations |
| Domain Simulator |
Simulating supply-side decision- |
To reflect the behavior of market participantsthat is not fully captured in historical data |
Table 1. The roles and necessity of each component in a hybrid forecasting system
First, the mechanism model served to represent the fundamental structure of lithium price formation. Lithium prices are not simply determined as an extension of past prices; rather, they are shaped by the interplay of factors such as electric vehicle demand, lithium supply, inventory, production capacity, and investment delays. Therefore, based on the demand, supply, inventory, and production capacity factors derived from the Refined Causal Map, we structured the relationships showing how each factor can influence prices and in what direction.
The deep learning model learned the complex fluctuation patterns observed in real-world data, which are difficult to explain based on this structure alone. In the lithium market, the impact of individual factors does not always manifest consistently. For example, even if demand increases, price increases may be limited if inventory is sufficient, and even if supply disruptions are minor, price volatility may increase if market uncertainty rises. This allowed the model to reflect price fluctuation patterns that arise when multiple conditions interact simultaneously, rather than the impact of a single variable.
However, there were areas that could not be fully explained by models based solely on historical data. A prime example is decision-making on the supply side. Even if lithium prices plummet, mining companies do not simply cut production mechanically; instead, they decide whether to continue production by considering factors such as the likelihood of price recovery, operating costs, contract terms, and the possibility of project delays. These individual decisions collectively determine the total supply, and the outcome, in turn, influences lithium prices.
To address this gap, LG Energy Solution has developed a domain simulator based on domain knowledge and expert judgment regarding the lithium market. The domain simulator is designed to estimate the continued production and potential supply volume for each mine by considering factors such as price levels, production costs, and operational sustainability. LG AI Research expanded this into a hybrid forecasting system by combining the scenario-based supply estimates derived from the simulator with mechanism modeling and deep learning.
In this regard, the domain simulator did not serve as a tool for retroactively adjusting forecast results, but rather incorporated supply-side decision-making structures, which are difficult to discern directly from the data, into the forecasting model.
These three elements were not used independently, but were linked based on the Refined Causal Map. The Refined Causal Map served as a common blueprint for determining which variables to include in the mechanism model’s structure, which combinations of variables the deep learning model should learn, and which conditions should be handled as separate rules and scenarios in the domain simulator.
As a result, the forecasting system was designed not simply by inputting a large number of variables, but by arranging the variables and model components in accordance with the lithium price formation mechanism.
In addition, following the forecast, we made it possible to verify not only the forecast values themselves but also the factors driving the forecast results. For example, if the predicted price rises, it is possible to determine which of the following factors played the primary role: increased demand, supply constraints, insufficient production capacity, or reduced inventory. Conversely, if a price decline is expected, it is possible to examine the contributing factors, such as increased supply, slowing demand, or increased inventory. This ability to explain how the forecast results were derived through underlying factors and causal structure is a key differentiator of this system.
2-4. Validating and refining forecasts using expert feedback
After building the hybrid forecasting system, we conducted repeated reviews of the model’s forecasts in collaboration with LG Energy Solution’s domain experts. In this process, the role of the industry experts went beyond simply verifying the forecast figures. The key was to jointly assess whether “this forecast is reasonable in the context of actual market conditions and business operations.”
When the forecast results differed from the domain experts’ intuition or did not align with the identified market structure, we analyzed the source of these discrepancies. We reviewed whether the influence of specific variables was overrepresented, whether supply delays or project lead times were realistically reflected, and whether the assumptions underlying the demand forecast were appropriate. These findings were then incorporated into our model improvement strategy.
This process was not simply a matter of training an AI model once and then checking its performance metrics; rather, it was more akin to a process of continuously reviewing and refining the forecast results. While AI models learn patterns based on the data provided, not all patterns can be considered meaningful signals in the actual market. Some patterns may be temporary noise, and some relationships may be coincidental correlations that held true only at a specific point in time.
Therefore, it was essential to have domain experts review the relationship observed in the data to determine which could be trusted and which required careful interpretation. Over the course of approximately two years, this project followed a cycle of forecasting → domain experts review → incorporation of feedback → model refinement, ensuring that the forecasting system was improved to a level where it could be used as a reference for actual decision-making.
This iterative validation process was not merely a means of improving the model’s quantitative performance. It went beyond simply verifying whether forecasts were correct or incorrect; it also involved reviewing the rationale behind the forecasts and assessing whether they were plausible from a domain expert perspective. This continuous process of linking the model’s results to domain expert judgment played a crucial role in building trust in the forecasting system.
2-5. Beyond accuracy to decision-making
The lithium price forecasting model developed in this project achieved a forecast accuracy of over 90% based on the 1-MAPE metric in back-testing using historical data, assuming accurate demand forecasts. Furthermore, when compared to the forecasts of major investment banks for the 2023–2025 period using the 1-MAPE metric, the model demonstrated approximately twice the level of forecast accuracy. (MAPE: Mean Absolute Percentage Error)
However, quantitative performance was not the only factor considered important in this project. For long-term commodity price forecasts to be effectively utilized in actual decision-making, it is essential to be able to explain why the forecast values were derived as they were, which market factors were taken into account, and whether there are any areas of conflict with the judgment of domain expert judgment.
The forecasting system developed for this project was designed not only to learn from past price patterns but also to incorporate key factors that shape lithium prices, such as demand, supply, inventory, production capacity, and supply-side decisions. Consequently, when forecast values rose or fell, it was possible to determine whether the change was due to increased demand, supply constraints, inventory fluctuations, or changes in supply volumes resulting from mining operation decisions.
This played a crucial role in ensuring that the forecast results were understood not merely as numbers, but as interpretable outcomes linked to market structures. LG Energy Solution’s domain experts were able to interpret and review the model results within the context of actual business operations by examining both the direction and the underlying rationale of the forecasts. While simply presenting the forecast values would have made it difficult to utilize them for decision-making, the ability to explain the basis and context of the forecasts allowed the results to serve as a valuable reference for actual decision-making.
Currently, this forecasting system is being used as a reference tool in LG Energy Solution’s upstream investment reviews and procurement decision-making processes. Starting this year, the forecasting system has entered a full-scale demonstration and validation phase to expand the system’s scope of application. In other words, the significance of this project lies in the fact that its outcomes have gone beyond merely validating model performance in the laboratory and have resulted in a forecasting system that can be utilized in actual business decision-making.
2-6. Future plans: Enhancing and expanding the hybrid forecasting system
The causal-based hybrid forecasting system developed in this project is designed to forecast prices over the long term. Due to the nature of long-term forecasting, it takes considerable time to definitively verify whether the forecasts were accurate. In particular, in raw material markets such as lithium, factors such as investment, capacity expansion, supply disruptions, and shifts in demand take years to be reflected in prices; therefore, it is difficult to fully assess the model’s reliability based solely on short-term performance metrics.
Therefore, we plan to continuously refine the forecasting system based on market data and domain expert feedback accumulated during actual operations. Rather than simply verifying whether the forecasts were accurate, we aim to examine how the forecasts are adjusted when new information is incorporated, and whether those changes are logically aligned with actual market conditions. The consistency and interpretability of this forecast update process can serve as important criteria for assessing the reliability of the long-term forecasting system.
This project was carried out in a phases, progressing through data preparation, causal structure design, modeling, integration with simulators, and domain expert review. This experience has provided for extending the forecasting system to similar long-term price forecasting projects and supply chain decision-making problems.
We also expect that agentic AI technology will help us develop and operate this forecasting system more efficiently. The approach involves having AI agents assist with repetitive tasks such as data exploration, reviewing candidate variables, model experimentation, code writing, and report generation, while researchers and engineers focus more on designing problem structures, reviewing domain assumptions, and interpreting forecast results.
Through this, we aim to streamline the construction and operation processes while maintaining the reliability of the forecasting system, and to expand its scope to address a wider range of industrial challenges.
What makes an AI forecasting system reliable
While working on this project, we were reminded once again that it is difficult to solve complex industrial problems using a single AI model alone. For an AI system to be used in actual decision-making, domain knowledge and expert insight must be combined with data; only then can it align with the underlying structure of the market.
Forecasting lithium prices required more than just a single, more sophisticated model. It required a forecasting system that could structure the factors driving prices such as supply and demand, inventory, production capacity, investment delays, and supply-side decisions and integrate them with mechanism models, deep learning models, domain simulators, and real-world feedback.
This is where the significance of this project lies. Beyond simply improving forecast accuracy, the project built a system that explains the structure and assumptions behind the forecasts and enables experts to review the results and use them as a reference for actual decision-making.
|
Reliable forecasts are not simply a matter of high accuracy. They can only be used in actual decision- |
This project is being carried out in close collaboration with LG Energy Solution’s Metal Investment Team and Big Data Analysis Team.
- 참고
[1] LG Energy Solution, “Reading the Future Through Data: Securing Cathode Material Purchasing Competitiveness Through a Mid- to Long-Term Lithium Price Forecasting Model” [in Korean], LG AX Fair 2025.
[2] Yang, Jie, Soyeon Caren Han, and Josiah Poon. "A Survey on Extraction of Causal Relations from Natural Language Text." Knowledge and Information Systems, vol. 64, no. 5, 2022, pp. 1161-86.
[3] Jin, Z., et al. "Large Language Models for Causal Discovery: Current Landscape and Future Directions." Proceedings of the Thirty-Fourth International Joint Conference on Artificial Intelligence (IJCAI 2025), 2025.
[4] Zanga, Alessandro, and Fabio Stella. "A Survey on Causal Discovery: Theory and Practice." International Journal of Approximate Reasoning, vol. 155 (2023): 101-129.
[5] Niu, Wenjin, et al. “Comprehensive Review and Empirical Evaluation of Causal Discovery Algorithms for Numerical Data.” Journal of Machine Learning Research, vol. 23, 2024, pp. 1?78. arXiv, arXiv:2407.13054.