 Minjun Park
2024.09.06
Minjun Park
2024.09.06
[ACL 2024] A New Approach to Chart Understanding and Reasoning
At ACL 2024, research related to chart understanding is gaining attention, with a particular focus on developing a general-purpose model to support a variety of tasks related to charts. In this article, we will take an in-depth look at "ChartInstruct: Instruction Tuning for Chart Comprehension and Reasoning[1]", one of the impressive studies on chart comprehension presented at ACL 2024. Additionally, we will introduce the ongoing research being conducted by LG AI Research.
1. Task: Chart Comprehension and Reasoning
Charts are an important element of data visualization and are widely used to analyze information, process queries, and communicate insights. While charts can clearly convey information visually, it is still a challenge for AI models to answer user questions based on charts. In recent years, a variety of chart-related research has been conducted to address this challenge, focusing on tasks such as answering and summarizing chart questions and making inferences.
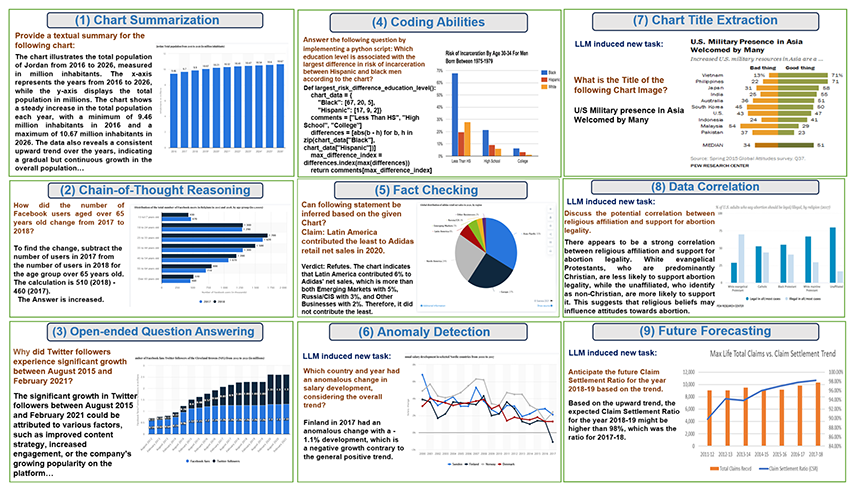
Image 1. xamples of various chart questions and answers시.
From basic questions like chart summarization, chart QA, and fact-checking, to tasks that require complex reasoning and data analysis such as data outlier detection, correlation analysis, and future prediction[1].
As shown in Image 1, analyzing and interpreting charts is essential for data analysis and decision-making, but extracting information from charts or understanding their meaning is not straightforward. Existing methodologies have limitations in dealing with visual information, and their application in the real world has been limited by their inability to clearly understand the relationships between complex elements in a chart. To address these issues, this research develops a chart-specific vision-language model, proposing a general-purpose approach that can perform a variety of tasks related to chart understanding.[1], [4] This research demonstrates novel performance on several tasks, including question answering, summarization, and reasoning, greatly expanding its potential for real-world applications.
2. Obtaining Datasets

Image 2. The process of obtaining chart data for instruction tuning.
Chart data is extracted via Gemini Pro Vision, and questions are generated via GPT 3.5 and GPT 4[1].
As there is limited open-source data available, the author used web crawling and question generation to obtain data. The overall process can be described as follows.
-
In the chart data collection phase, a variety of charts commonly seen in the real world are collected. Charts are collected from a variety of sources, including public datasets (e.g., UniChart) and charts directly crawled from the web.[2] The types of charts include different visual styles such as bar graphs, line graphs, and pie charts.
-
After collecting charts, data table information and chart titles are automatically extracted to obtain the necessary information from the collected chart images. In this process, Gemini Pro Vision[5] is used to extract a data table to generate the input data needed for model training.
-
The extracted table data is used to generate data to answer questions. These questions are generated through LLMs such as GPT-3.5 or GPT-4,[3] and include a variety of tasks such as summarizing charts, answering questions, fact checking, chain of thought reasoning[6], and code generation.
-
Finally, the chart data and generated questions are used for model training and tuning. During the training process, different model architectures (e.g., end-to-end systems such as LLaVA[4] or pipeline systems) are used to improve the model’s ability to understand visual information and generate language (see approach below).
Ultimately, a total of 191,000 instructions were generated for 70,882 charts. These charts were collected from a variety of sources, and the LLM utilizes information from each chart to obtain diverse QA datasets.
3. Approach: Vision Encoder + Adapter Module + LLM
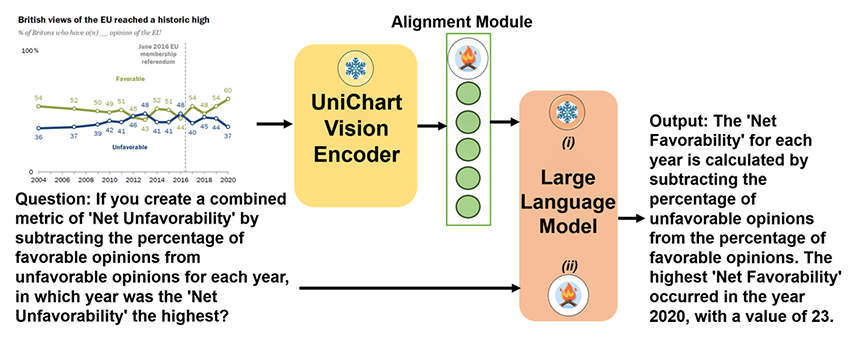
Image 3. Structure of the end-to-end system model.
Weights are frozen in the pre-training stage, and learning is performed for various chart types in the instruction tuning stage[1].
The data generated is then used to train the model. Eventually, the model will be able to combine visual information (chart images) with a language model to understand the content of the chart and generate responses in natural language. The main components of the model are as follows:
-
Vision Encoder: A vision encoder based on a model called CLIP[7] was originally used but was replaced in the ChartInstruct model with UniChart, an encoder trained specifically for charts. UniChart is optimized to understand chart images effectively.
-
Adapter Module: Also called the Alignment Module, this module converts the visual features extracted by the vision encoder into a form that the language model can understand. It helps the language model interpret the chart image correctly by mapping the visual features into the input embedding space of the language model.
-
LLM: In this system, two language models are used experimentally: a) Llama2[8]: A model with a decoder structure, in which visual features are directly fed into a linguistic decoder to generate text. b) Flan-T5[9]: A model with an encoder-decoder structure, in which visual features and commands are first processed by a linguistic encoder, and then text is generated by a decoder.
-
Model Training Phase: In the first phase, only the adapter module is trained, while the vision encoder and language model remain frozen. This phase focuses on aligning the visual features and with the language model’s input embeddings. In the second phase, the entire model (adapter module and language model) is trained using the command data. At this point, the vision encoder remains frozen.
4. Results
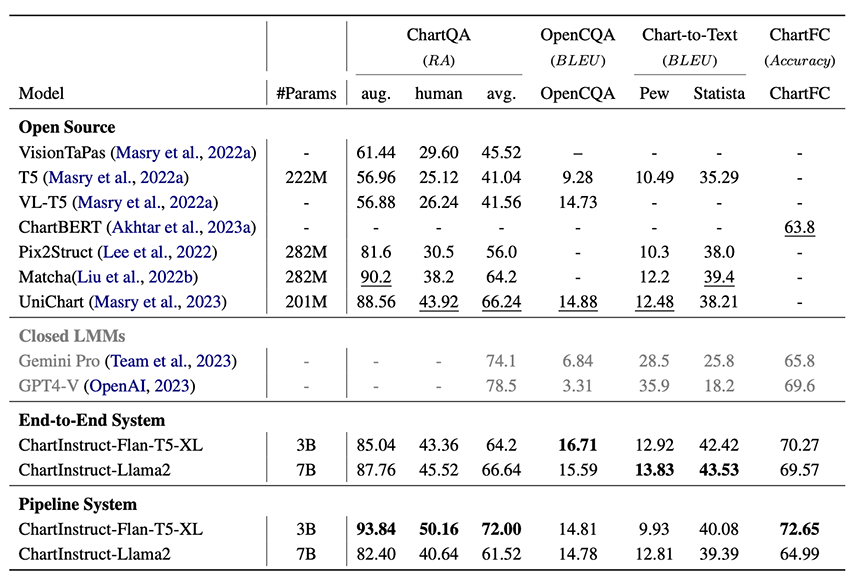
Image 4. Performance metrics in ChartQA, OpenCQA, Chart-to-Text, and ChartFC (Fact-Checking)[1].
The results of the ChartInstruct model demonstrate excellent performance in a variety of chart-related tasks:
-
ChartQA: In the task of answering questions about charts, the ChartInstruct model outperformed the previous state-of-the-art (open-source) model, UniChart, especially when answering complex questions written by humans.
-
OpenCQA: This task involves generating answers to descriptive questions about charts. The ChartInstruct model also achieved a high BLEU score in this task, demonstrating that it can generate more appropriate answers to descriptive questions.
-
Chart-to-Text: In the task of summarizing charts into text representations, the ChartInstruct model outperformed UniChart on both datasets (Pew Research Center and Statista).
-
ChartFC (Fact Checking): In the chart-based fact-checking task, the ChartInstruct model significantly outperformed previous models in fact-checking accuracy.
Overall, the ChartInstruct model achieved new state-of-the-art performance in chart understanding and reasoning tasks and can be used as a very useful tool in a variety of real-world applications.
5. LG AI Research Tasks
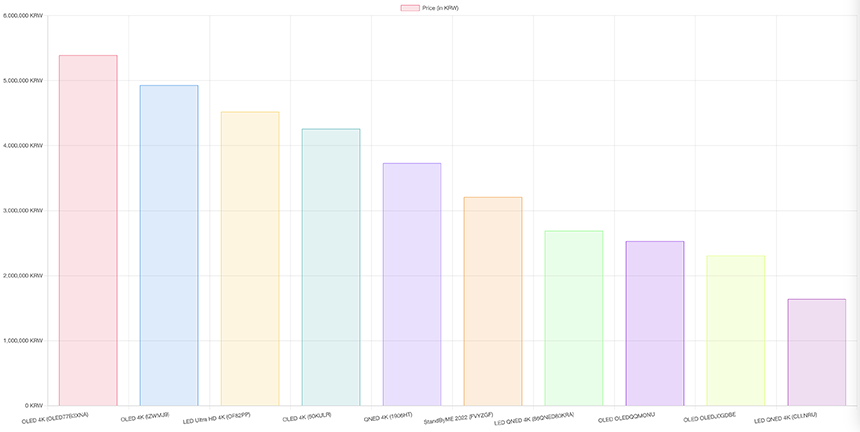
Image 5. A bar graph chart generated by ChatEXAONE.
(* Question: Give me the top 10 models in order of price.)
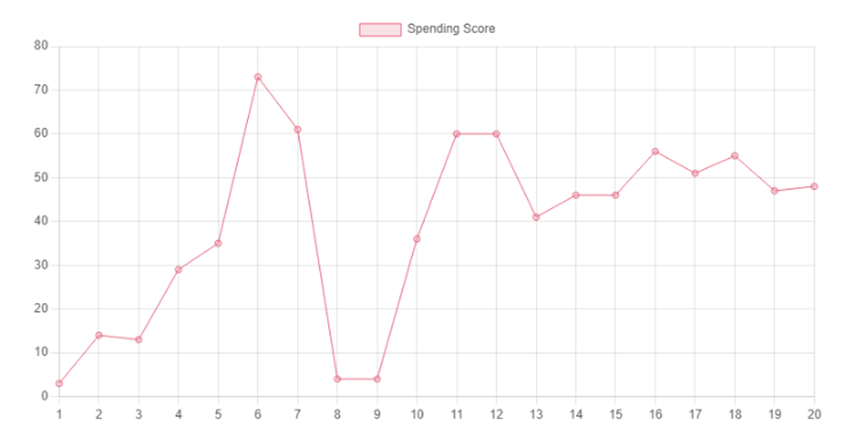
Image 6. A line graph generated by ChatEXAONE.
(* Question: Tell me consumption index of men over 30 years old.)
At LG AI Research, we are interested in developing chart generation and explanation models for data analysis. One example is the Text-to-SQL module, which generates SQL queries when a user asks a question to the database and creates a chart of the executed results. Figures 5 and 6 show the results of charting the values when a user asks the questions “Give me the top 10 models in order of price” and “Tell me consumption index of men over 30 years old,” respectively, in conjunction with the database. As such, if we can extract additional chart information about the generated chart and extend it with models of related inference, COT, summary, and forecasting features, we can provide users with useful information about the chart다.
In addition, for data that contains a variety of information, such as CSV or Excel files, exploratory data analysis (EDA) or statistical analysis is often necessary. During data analysis, various charts are generated by the LLM in code for better understanding, and in this case, the chart vision model can be a great help in chart analysis. In particular, if the data used for the chart is too large of an amount to ask the LLM to analyze all the values in text format (i.e., context length issue), it is often computationally and time-efficient to view the chart image and extract the information to answer the question.
Similar to the model proposed in this ACL 2024 paper, researchers are working on developing a model that can generate automated explanations for complex charts. This model will be a useful tool even for users who are not familiar with data analysis and is expected to play an important role in future data analysis work.
6. Summary
Analyzing and interpreting charts is essential for data analysis and decision-making, but extracting information from charts or understanding their meaning is not straightforward. Existing methodologies have limitations in dealing with visual information, and their application in the real world has been limited by their inability to clearly understand the relationships between complex elements in a chart. To address these issues, this research develops a chart-specific vision-language model, which proposes a general-purpose approach that can perform a variety of tasks related to chart understanding. This research demonstrates novel performance on several tasks, including question answering, summarization, and reasoning about charts, greatly expanding the potential for real-world applications.
Based on the latest technologies presented at the conference, LG AI Research plans to further improve the performance of our chart understanding and explanation models. In particular, we will focus on developing a general-purpose model that can handle various tasks related to charts, and add new features for data analysis and decision support by enhancing the automated explanation features for the generated charts. Furthermore, based on the discussions at the conference, we will explore various possibilities for using chart data and apply them to ChatEXAONE.
ACL Trends Review Series
#1. [ACL 2024] Emerging Trends and Key Insights in LLM Research
#3. [ACL 2024] Towards efficient Large Language Models
#4. [ACL 2024] AI-generated Text Detection Research Trends
#5. [ACL 2024] Research Trends in LLM Evaluation Methods for Faithfulness and LLM Efficiency
#6. [ACL 2024] Developing a Large Language Model with Cross-Cultural Considerations
- 참고
[1] Masry, Ahmed, et al. "ChartInstruct: Instruction Tuning for Chart Comprehension and Reasoning." arXiv preprint arXiv:2403.09028 (2024).
[2] Masry, Ahmed, et al. "Unichart: A universal vision-language pretrained model for chart comprehension and reasoning." arXiv preprint arXiv:2305.14761 (2023).[3] Ray, Partha Pratim. "ChatGPT: A comprehensive review on background, applications, key challenges, bias, ethics, limitations and future scope." Internet of Things and Cyber-Physical Systems 3 (2023): 121-154.
[4] Liu, Haotian, et al. "Visual instruction tuning." Advances in neural information processing systems 36 (2024).
[5] Reid, Machel, et al. "Gemini 1.5: Unlocking multimodal understanding across millions of tokens of context." arXiv preprint arXiv:2403.05530 (2024).
[6] Wei, Jason, et al. "Chain-of-thought prompting elicits reasoning in large language models." Advances in neural information processing systems 35 (2022): 24824-24837.
[7] Radford, Alec, et al. "Learning transferable visual models from natural language supervision." International conference on machine learning. PMLR, 2021.
[8] Touvron, Hugo, et al. "Llama 2: Open foundation and fine-tuned chat models." arXiv preprint arXiv:2307.09288 (2023).
[9] Chung, Hyung Won, et al. "Scaling instruction-finetuned language models." Journal of Machine Learning Research 25.70 (2024): 1-53.